App Glyconnect for Humanized Solutions

Glyconnect is a tracking and support app for families living with Congenital Disorders of Glycosylation (CDG), created for Humanized Solutions as part of a project for a Master’s degree in Usability and User Experience.

Role
UX Researcher (research lead) and product designer

Project type
Master’s Thesis – Master’s in User Experience Design, UNIR. Business challenge from Humanized Solutions

Team
Raúl Cerda
Remedios Broceño
Madeline Quirós

Tools
Figma, FigJam, Generative AI (synthesis and ideation, ASCII wireframes), Notion, Microsoft Teams

Deliverable
High-fidelity interactive prototype validated with the CDG community

Duration
5 months

Summary

People living with Congenital Disorders of Glycosylation (CDG) — a group of more than 170 rare diseases — and their families experience fragmented care, isolation, and an odyssey to reach a diagnosis that today’s digital ecosystem, almost nonexistent in Spanish, fails to solve.

I led the research for a project that started with the challenge of very limited access to users, given how rare this group of diseases is. We built a solid foundation with rigorous secondary research and benchmarking, translated into archetypes, empathy maps, a value proposition, and a patient journey map. From there we moved to a tentative PRD, a prioritized MVP, and the information architecture, which we turned into a high-fidelity prototype whose main purpose was the large-scale collection of biometric and patient-tracking data.

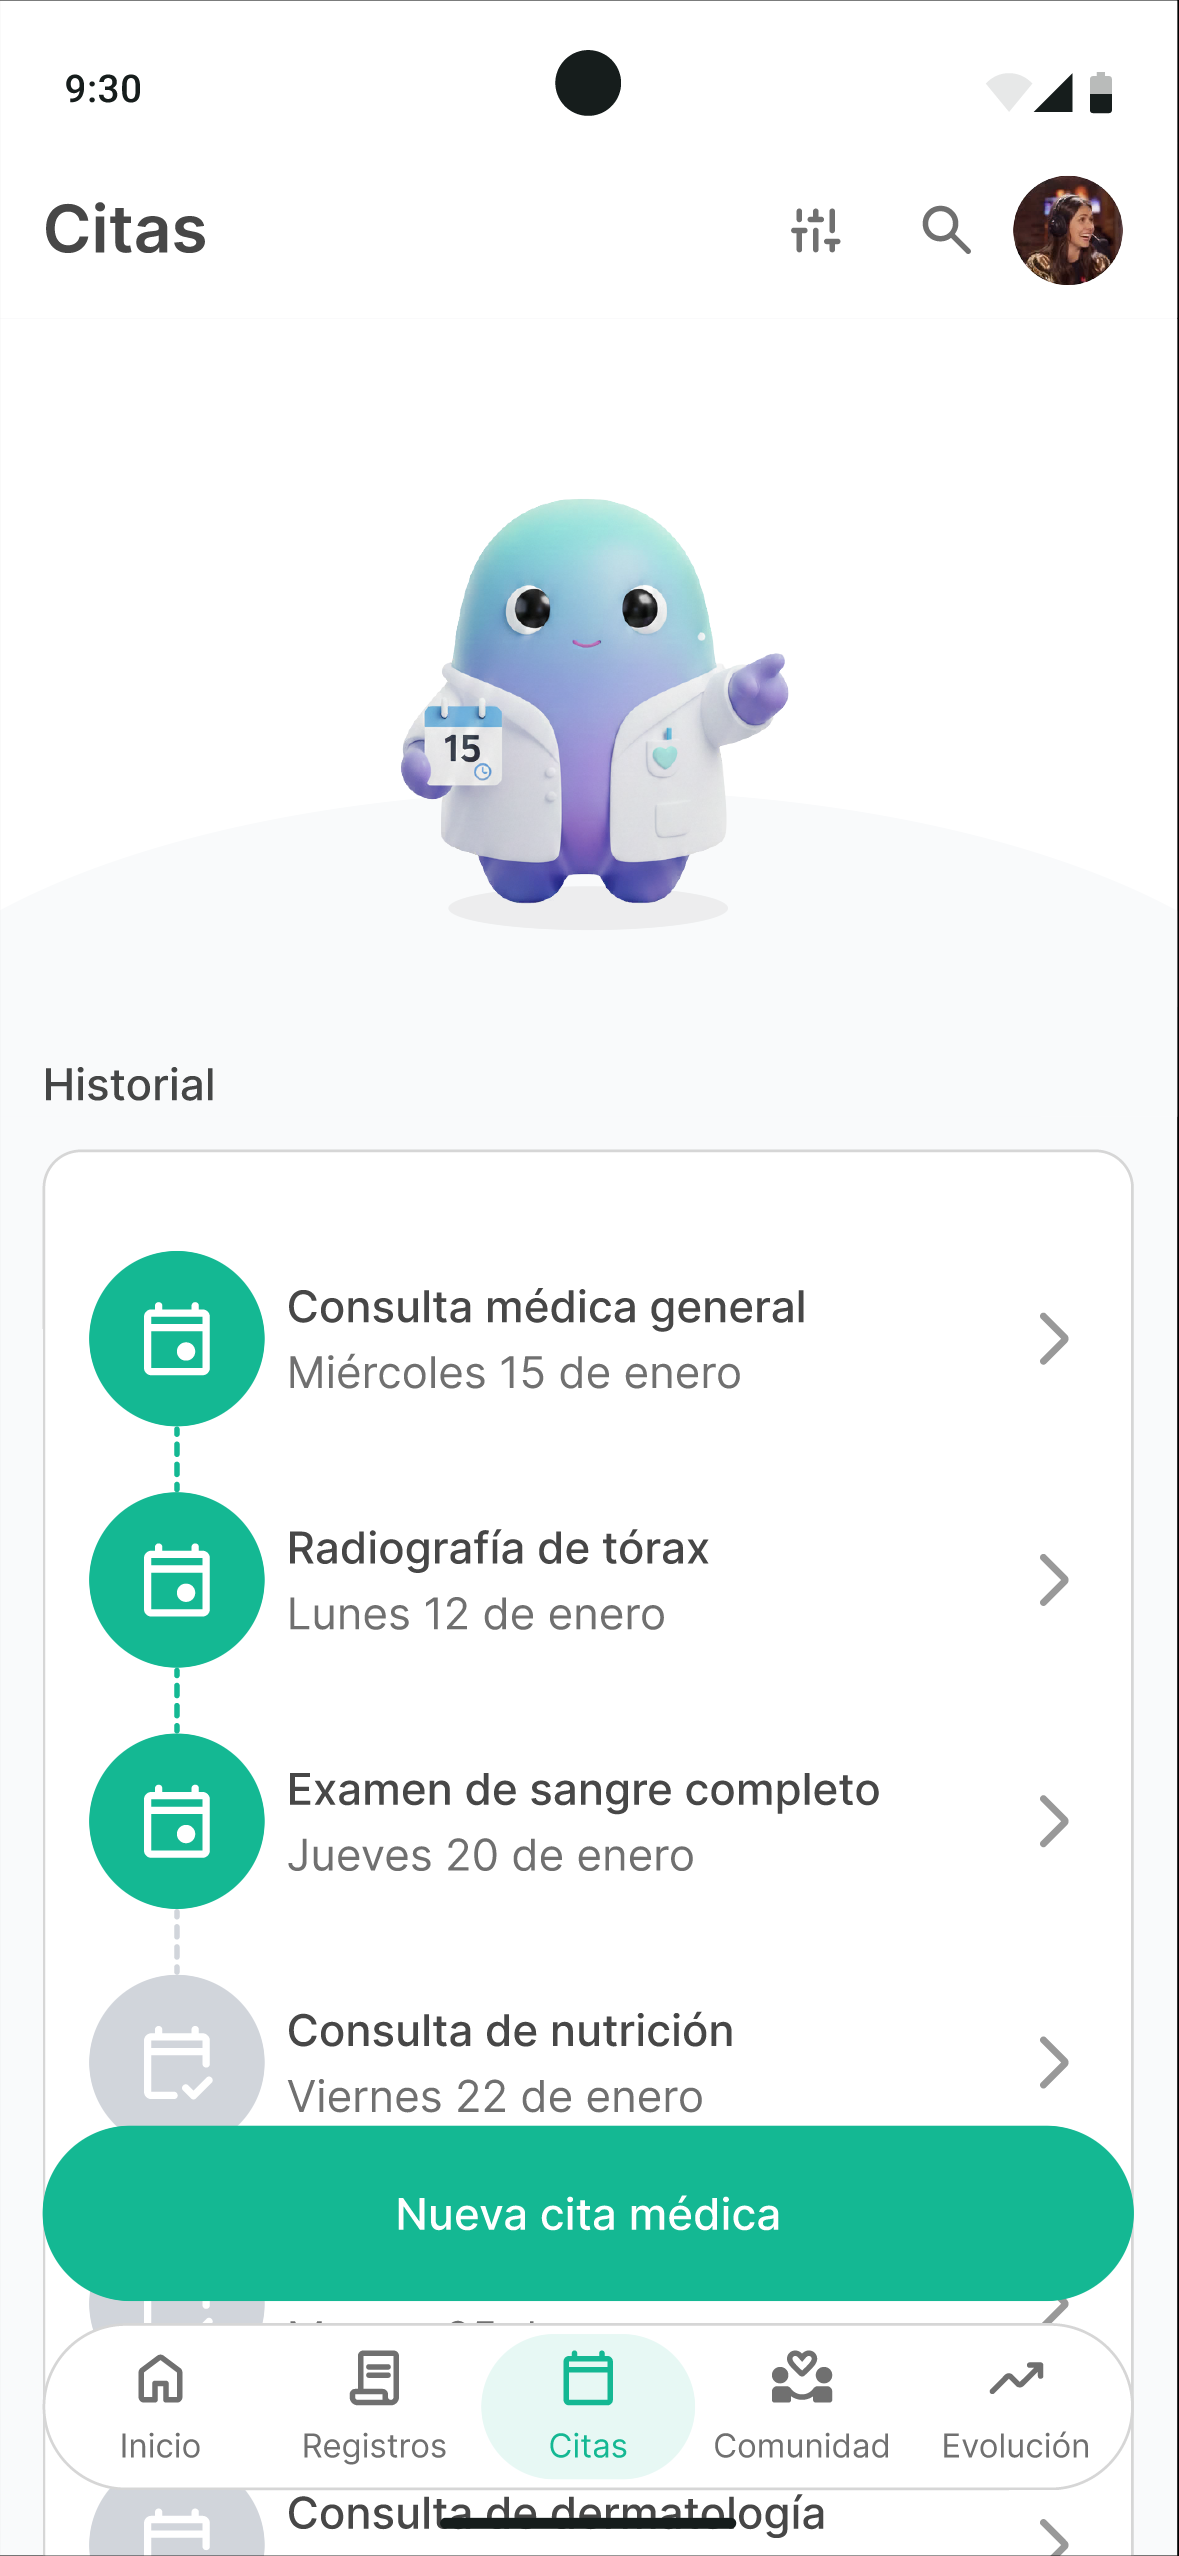
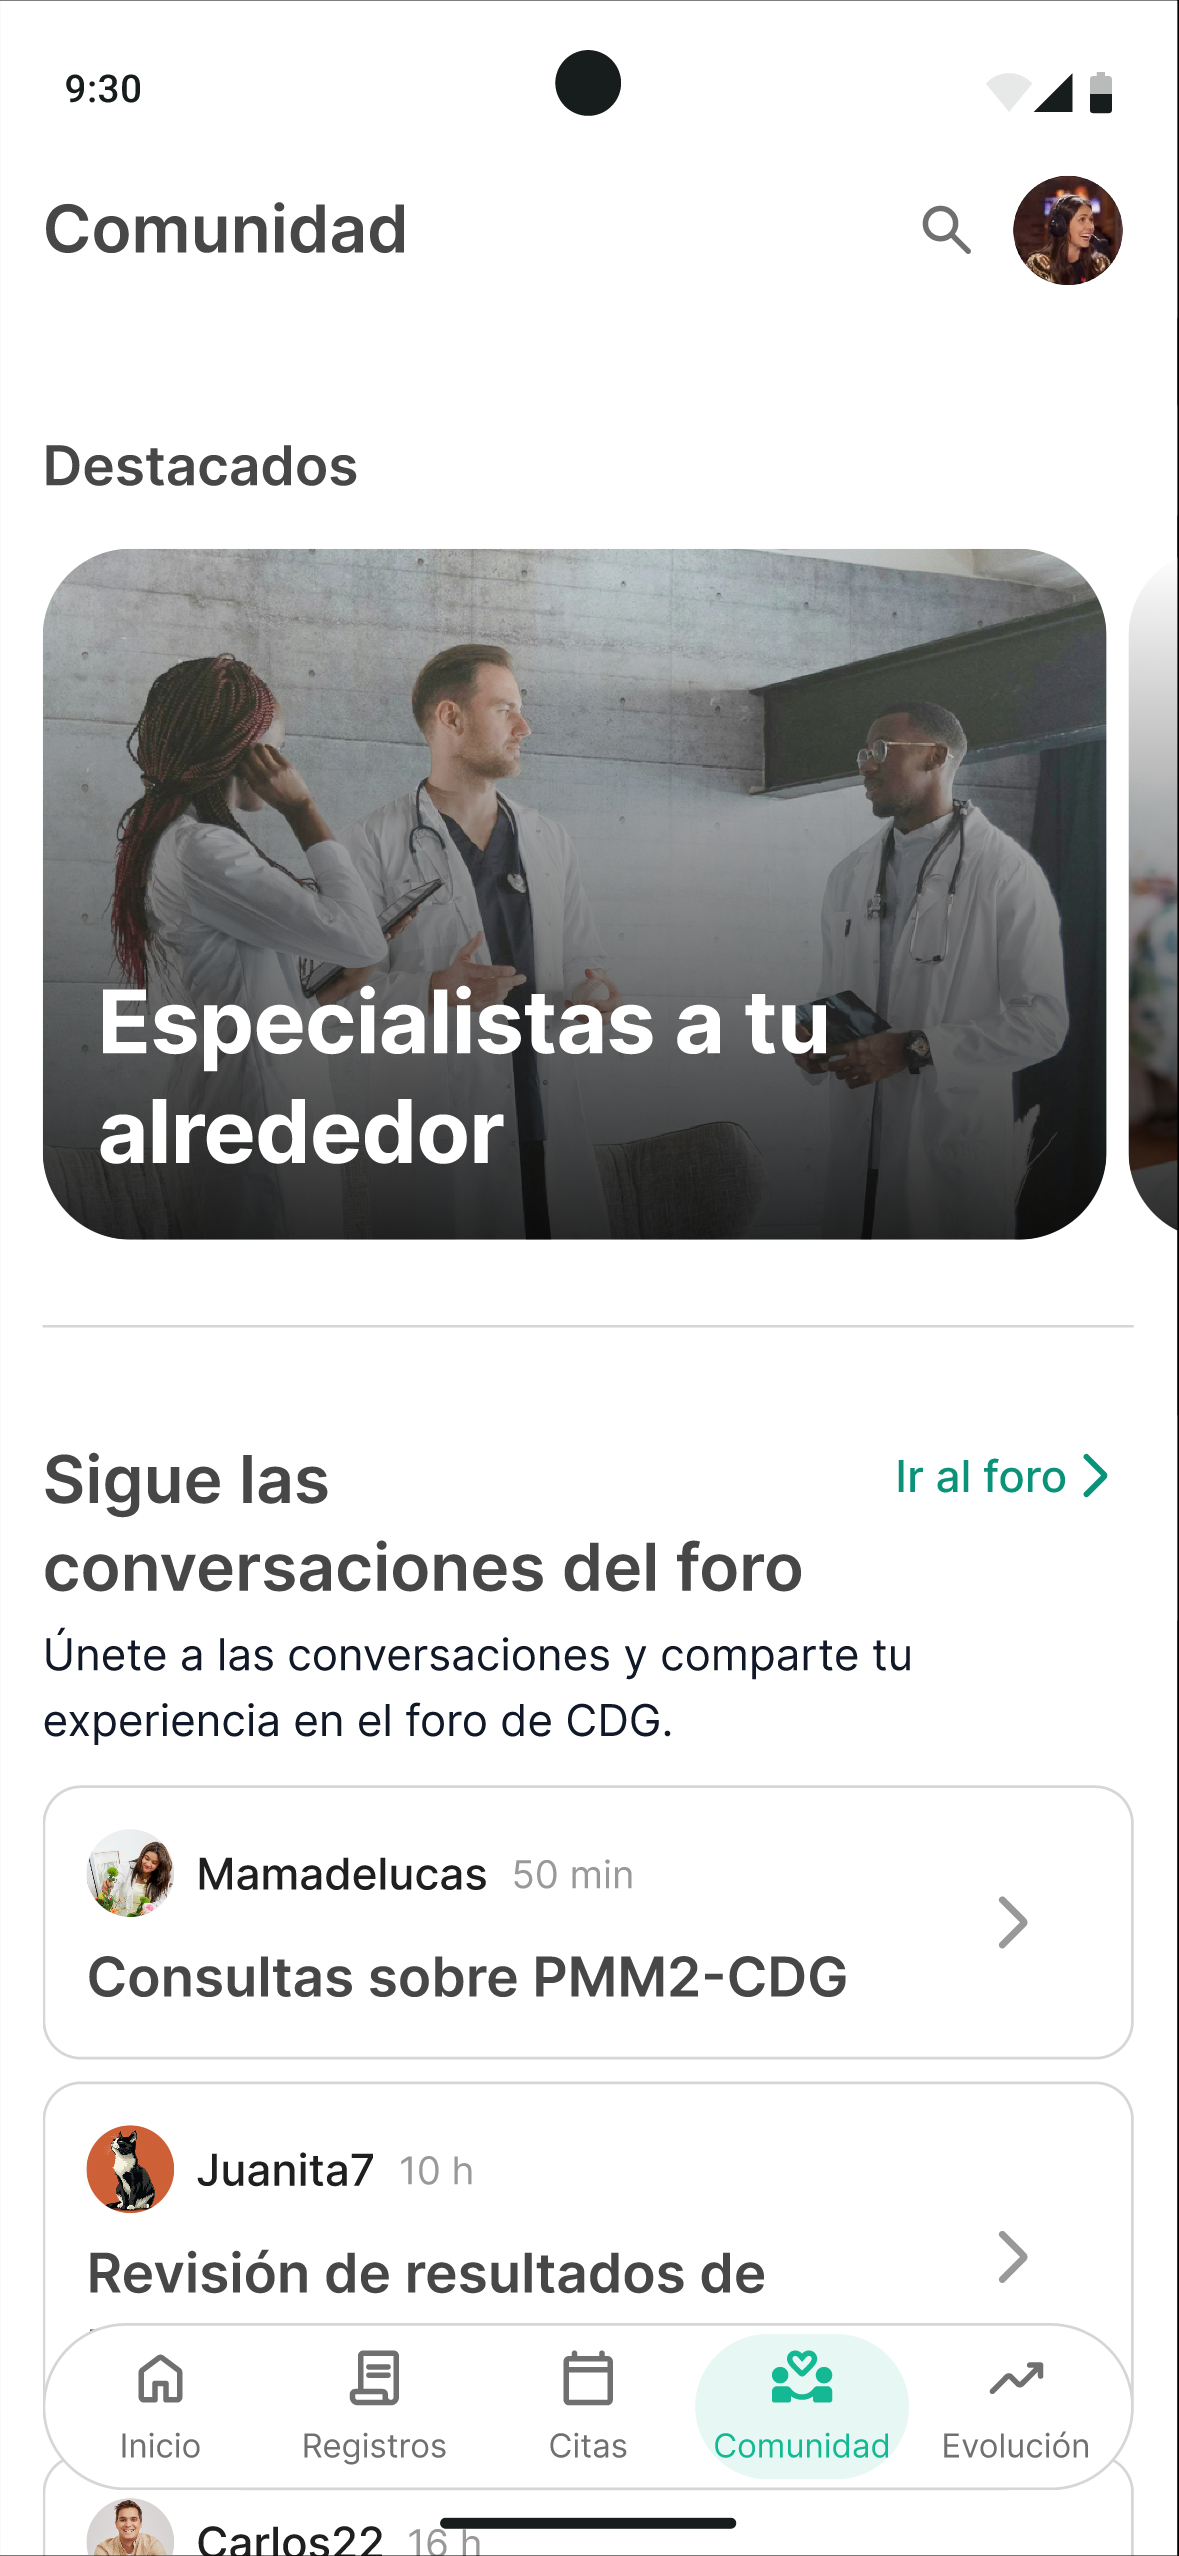
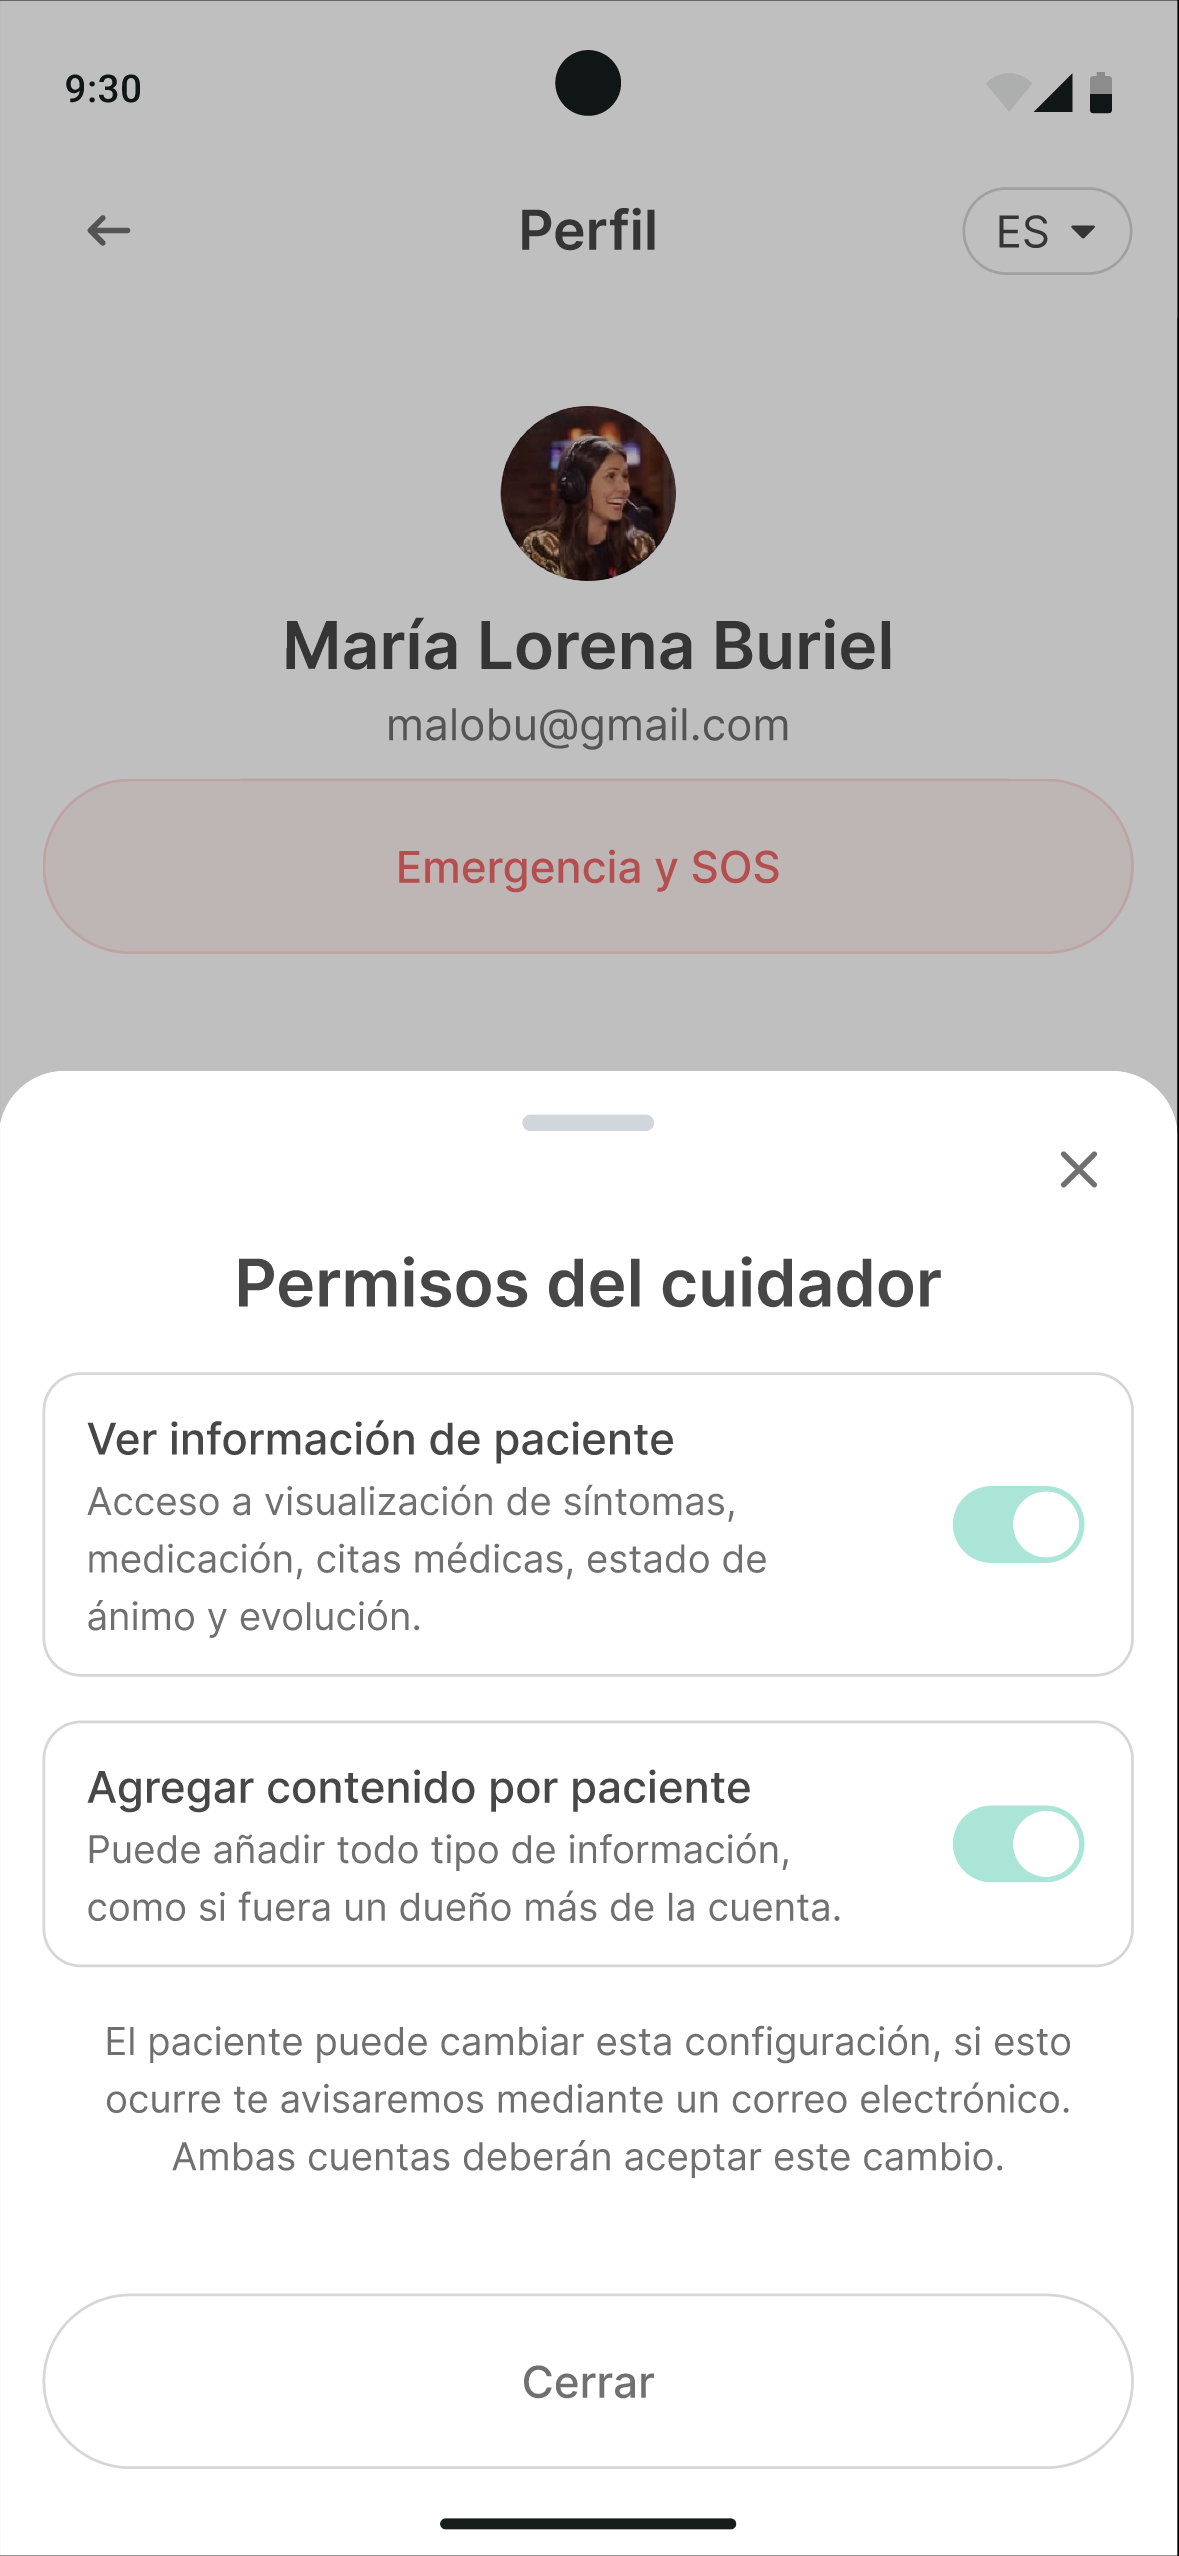
That prototype was taken to a focus group with the CDG community, and the result was the project’s turning point: the community told us their most urgent need wasn’t daily tracking, but immediate access to critical information in emergencies, fostering a community, and getting guidance on what to do as first steps after receiving a diagnosis. We pivoted the prototype from a self-management tool to an empowerment and information platform, adding an emergency module, a community space, a forum, and presentations.

This project represents the ability to take a complex, systemic, and emotionally sensitive problem, conduct research with rigor and ethics, and have the professional humility to pivot the proposal when the evidence demands it.

The challenge

Rare diseases affect more than 300 million people worldwide (between 6% and 8% of the population), spread across 5,000 to 8,000 distinct conditions. In the European Union, a disease is considered rare when it affects fewer than 1 in 2,000 people.

Within that universe are Congenital Disorders of Glycosylation (CDG). More than 170 metabolic diseases that disrupt the glycosylation of proteins and lipids, a process essential to their function. They typically appear in childhood and have an extremely variable, multisystem impact (neurological, hepatic, cardiac, immune) from one patient to another.

Why this matters
The literature describes these families’ journey as a “diagnostic odyssey,” including delays, misdirected referrals, poor coordination between specialists, and lost information between appointments. It’s a clinical process, but above all an emotional and prolonged one, whose burden falls disproportionately on caregivers.

On top of this there’s a digital divide, where most existing resources are in English and are either purely informational or overloaded. Spanish-speaking patients are left with almost no coverage, and if you factor in Latin American countries, everything becomes much harder.


Problem statement.
CDG patients and their families face fragmented follow-up care, poor coordination between professionals, and almost no digital tools in Spanish adapted to their day-to-day lives.


Hypothesis.
A mobile app can reduce care fragmentation and isolation by centralizing verified information and making it easier for patients, caregivers, and professionals to communicate (especially in the Spanish-speaking context).


The conclusion that guided the whole project was that a useful digital solution can’t limit itself to collecting data, even though that’s the most important thing for research into these diseases. This solution has to reduce cognitive load, adapt to the real pace of life, and provide support without adding more weight to people who already carry too much.

My role

This was a three-person team project. My contribution was one of leadership: I coordinated the project, the communication, and the whole process through to delivery, and led the research and product definition all the way to the final prototype.

What I led or was the primary author of

  • User research (lead of the UX Research phase), with support from the team.
  • Designing the semi-structured interview scripts and surveys (patients/caregivers and doctors/researchers).
  • Benchmarking of digital health apps.
  • User archetypes, empathy maps, and value proposition canvases.
  • The PRD (Product Requirements Document).
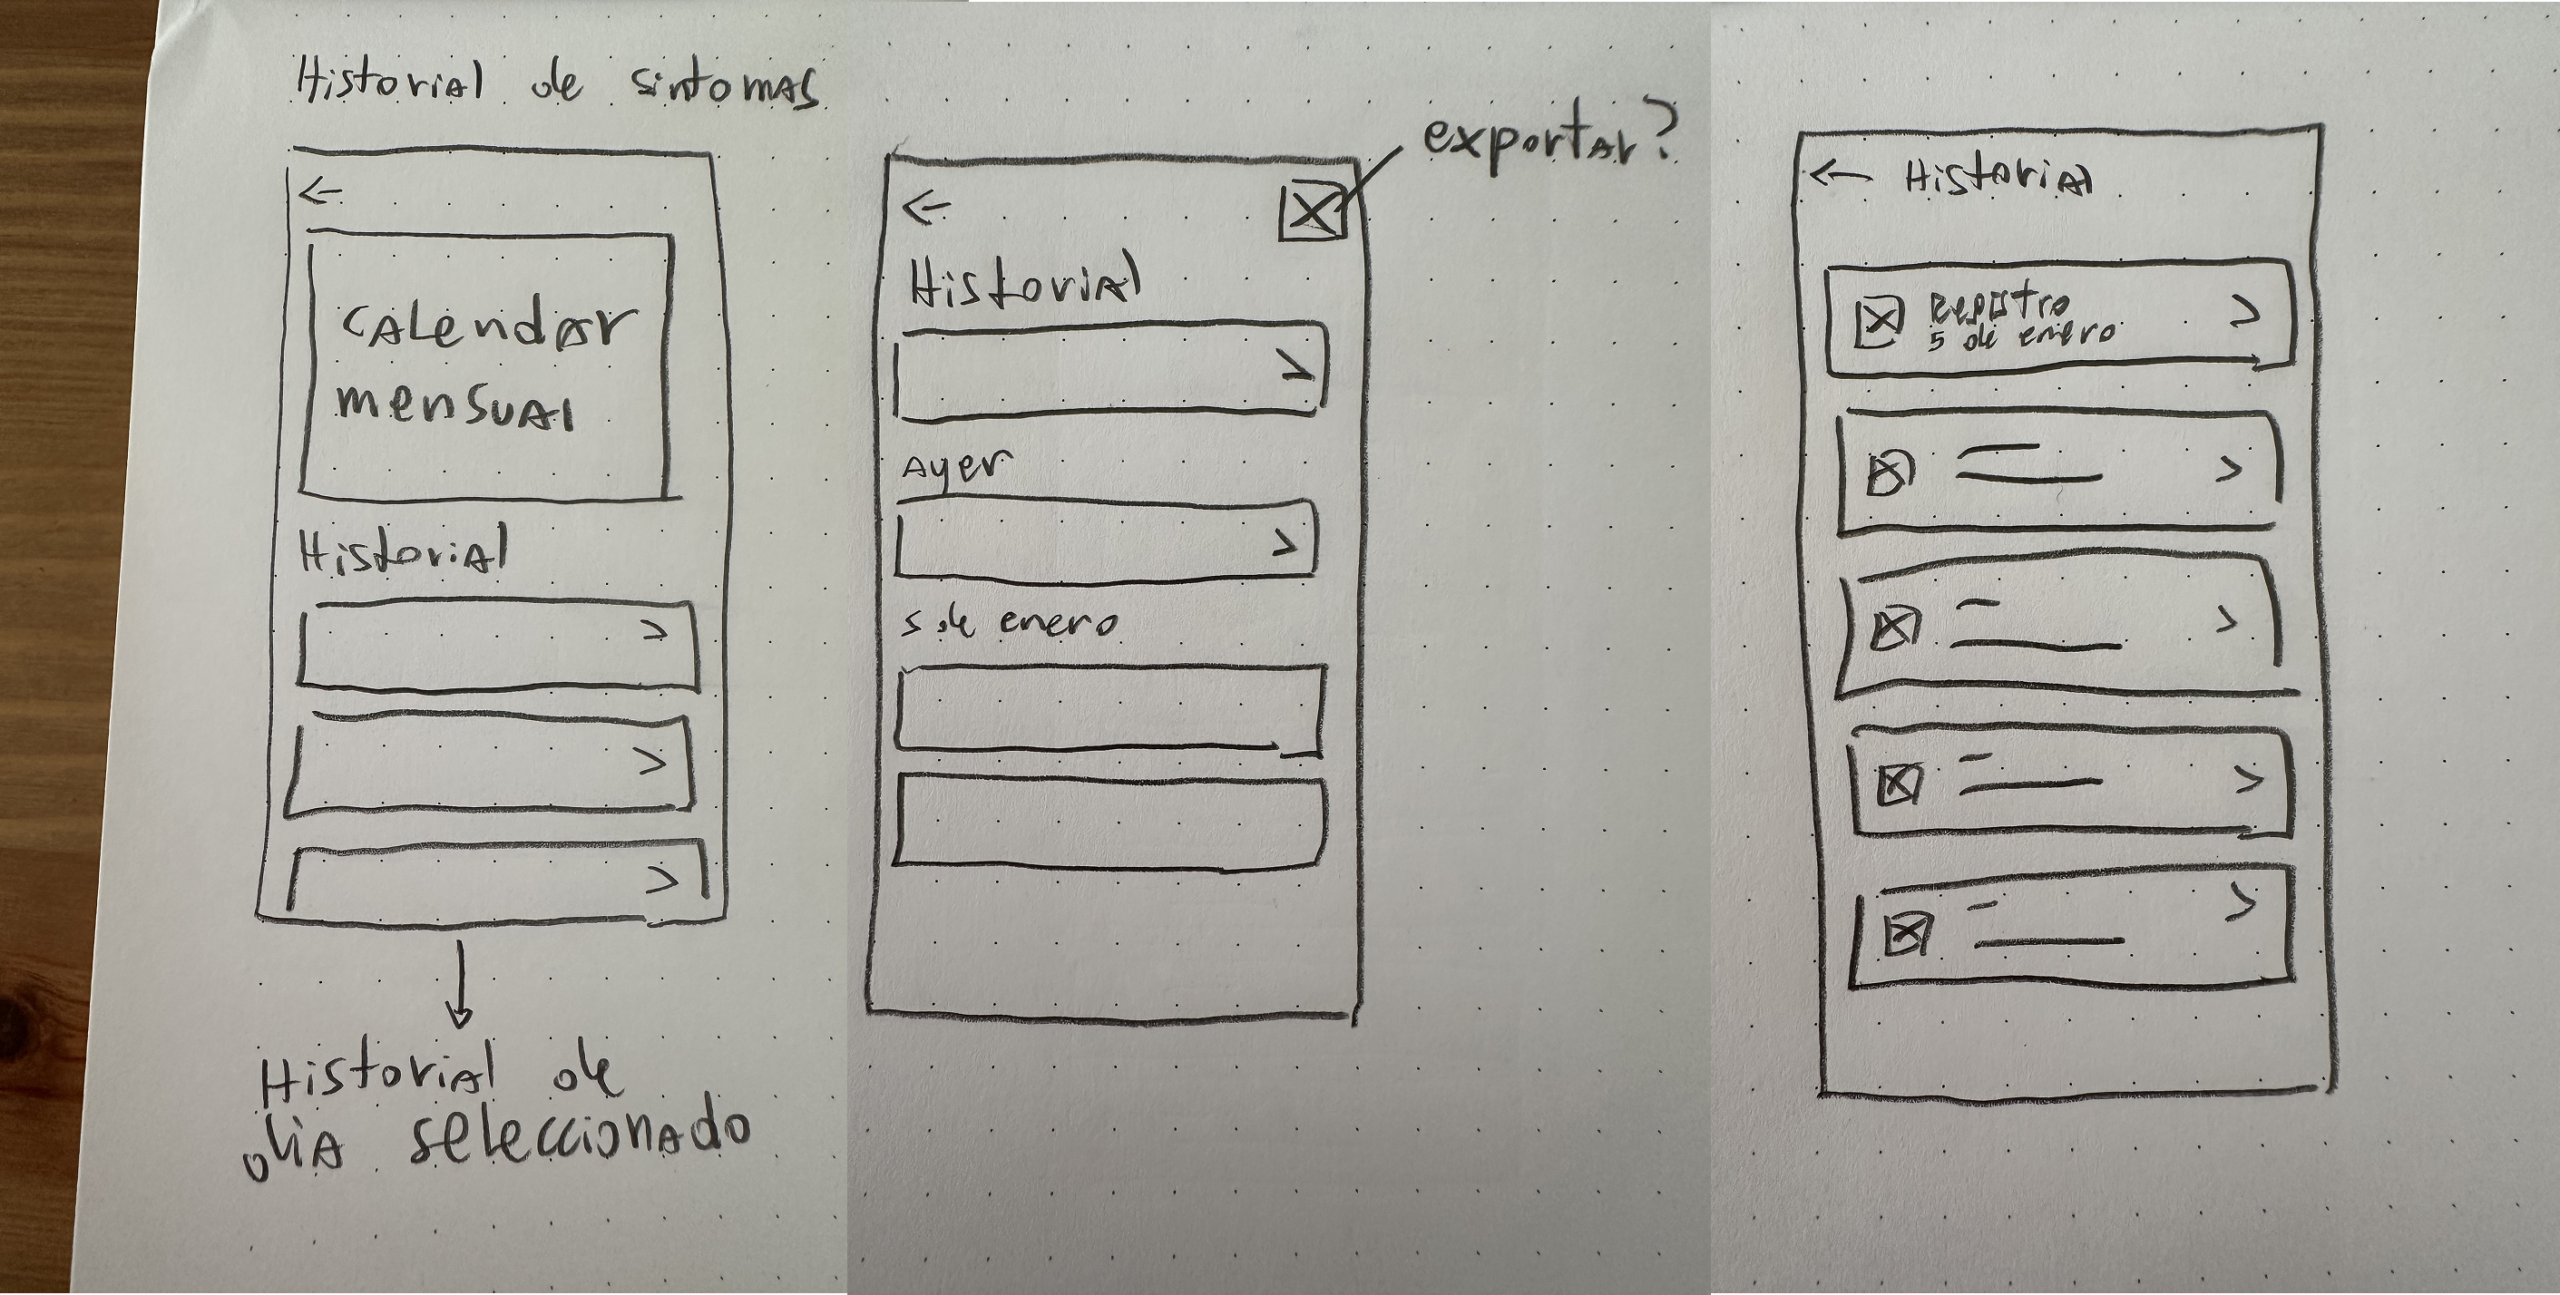
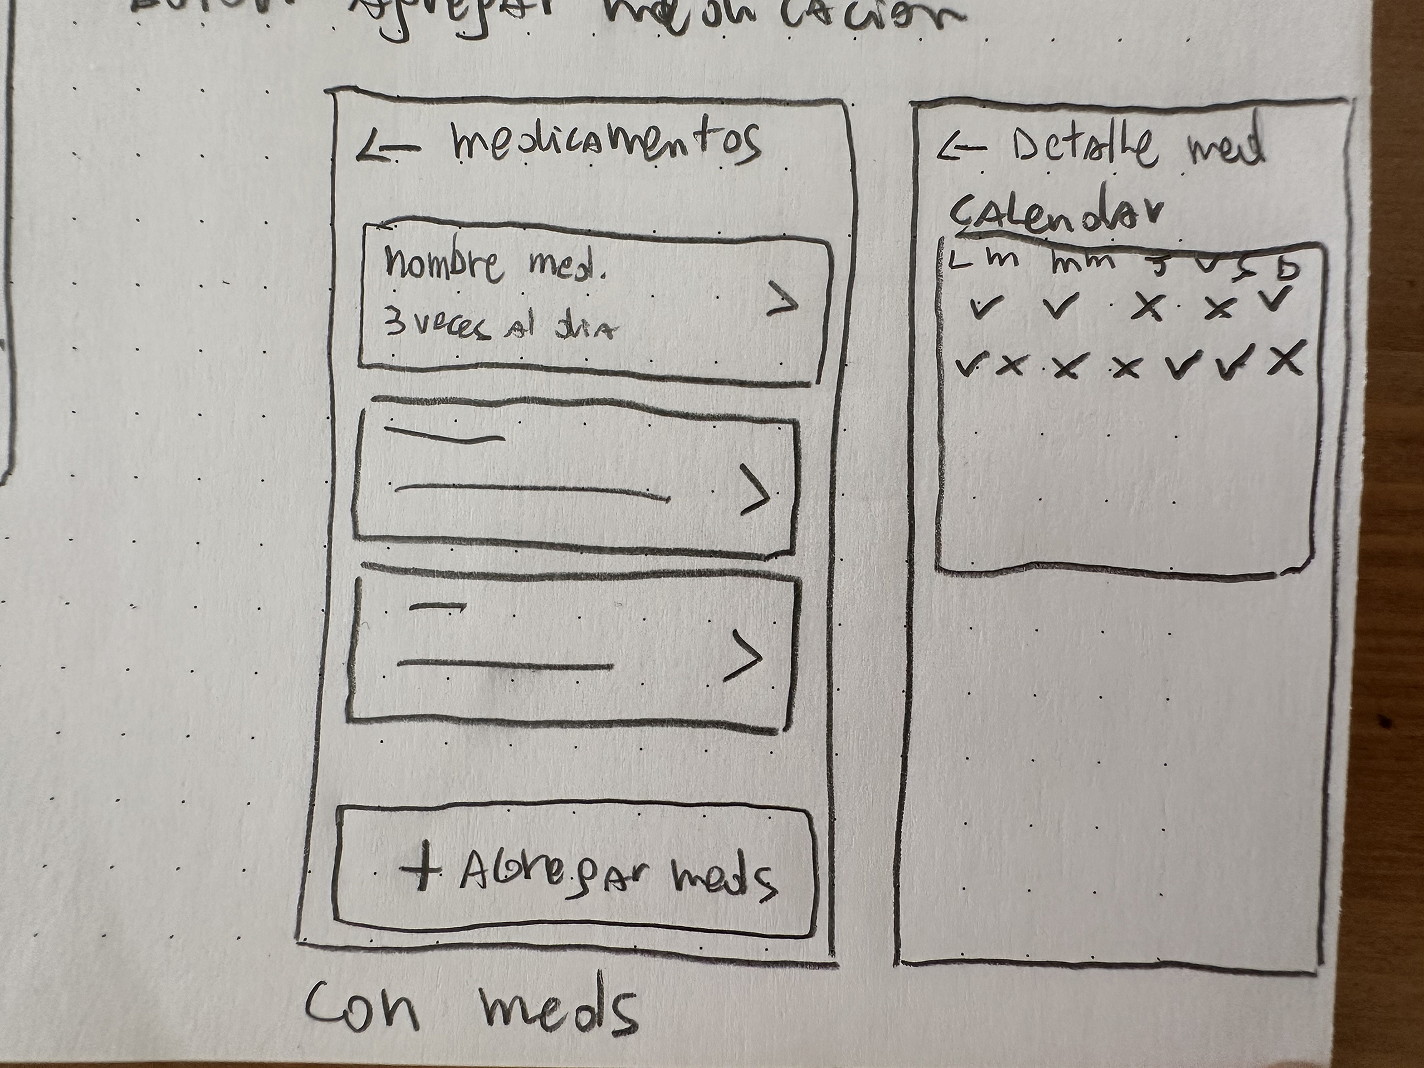
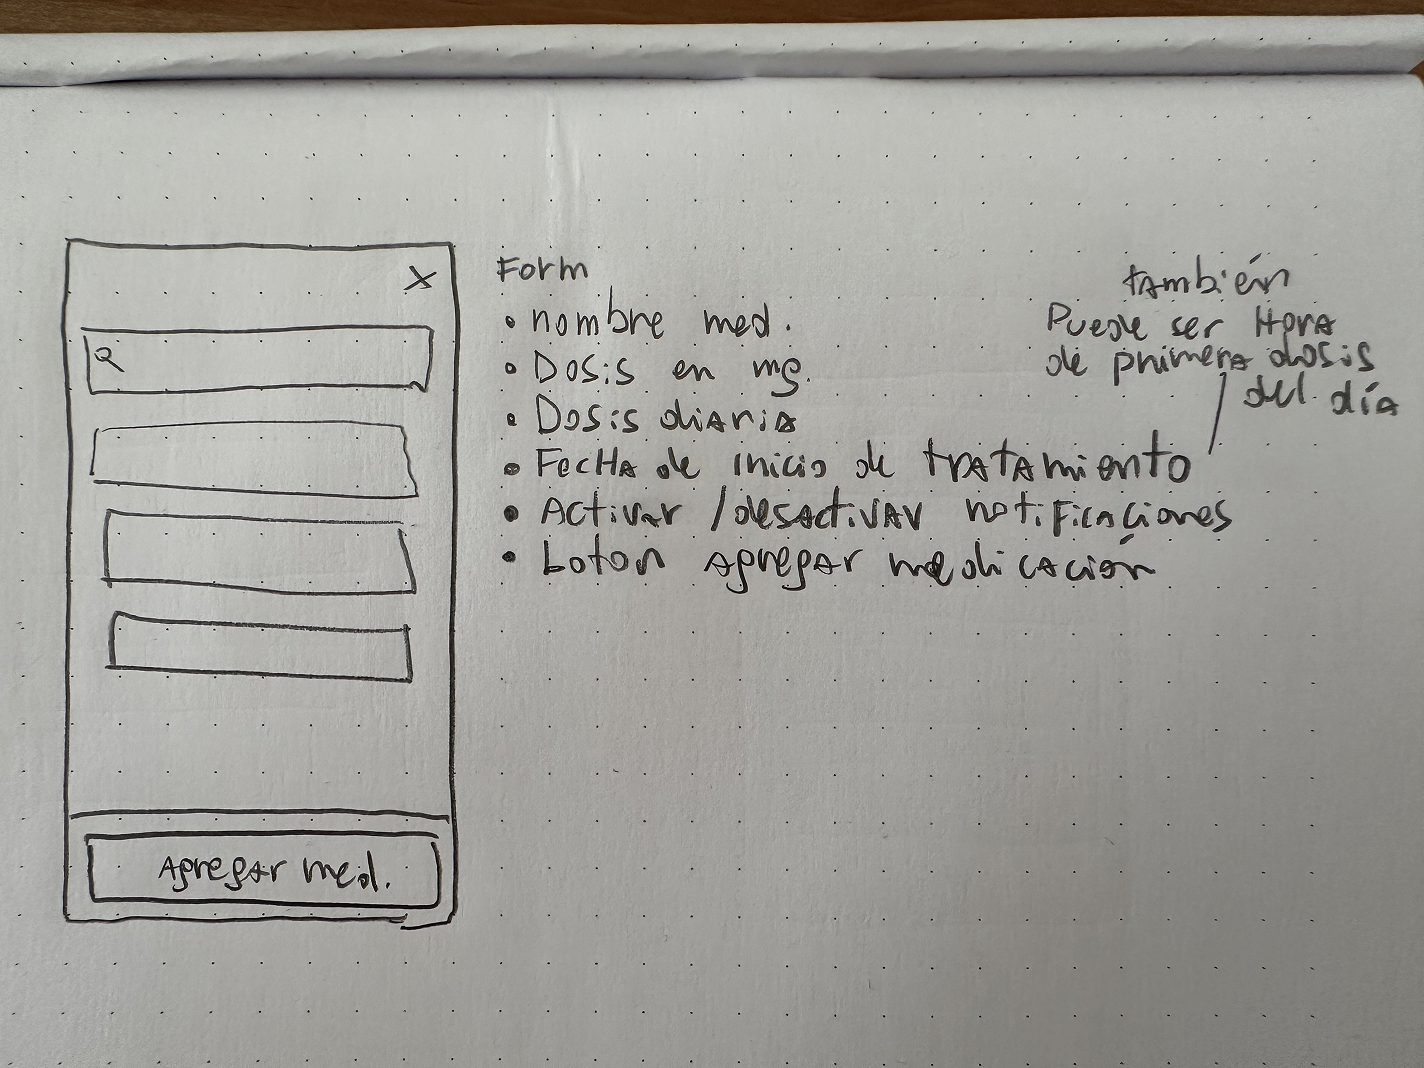
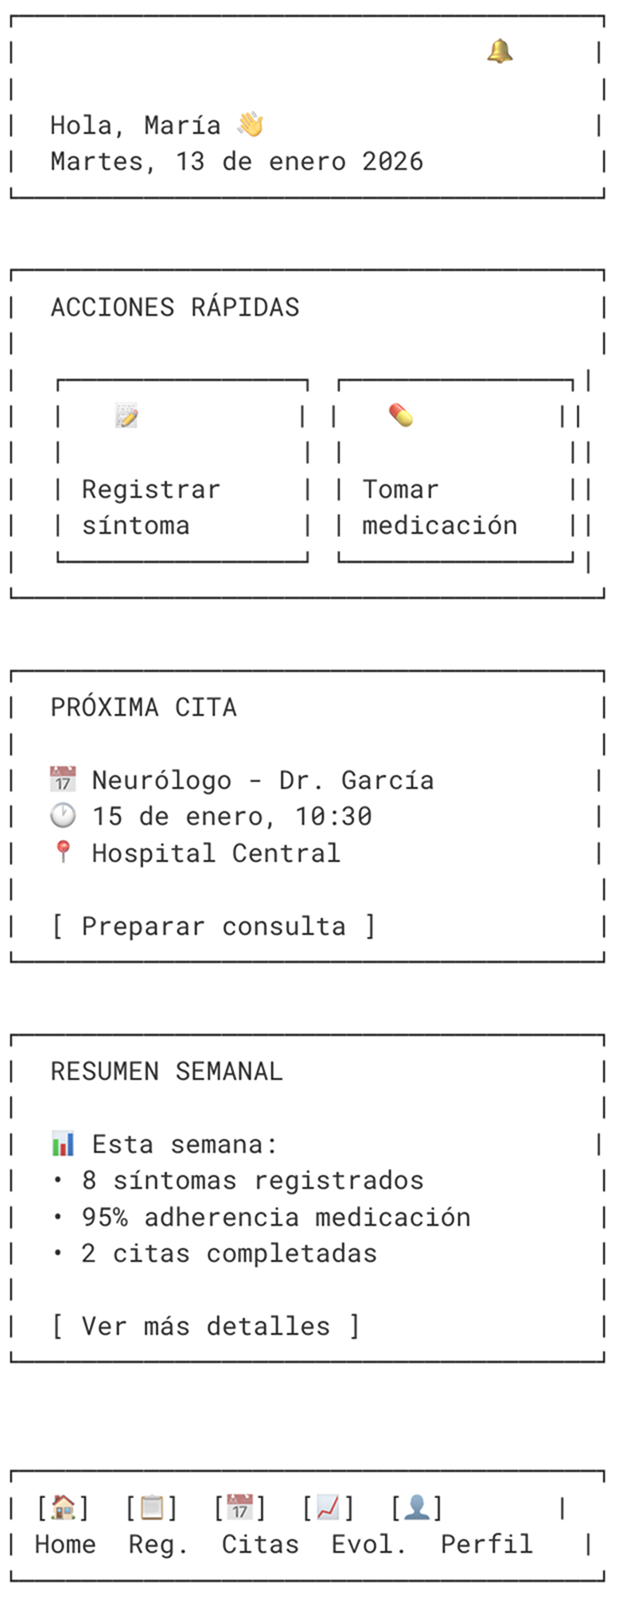
  • Paper wireframes and AI-generated ASCII wireframes to structure the solution before moving to digital.
  • The high-fidelity prototype tested in the focus group and the final iterated prototype.

What I contributed to collaboratively

  • Co-authoring the context and state-of-the-art chapter.
  • Information architecture.
  • Prototype components and contributions to the UI kit / design system (built as a team).

Our team working method followed practices typical of a professional environment, including management in Notion, a shared repository in Teams, fixed weekly meetings, and collaborative sessions in Figma/FigJam.

Process and methodology

The project followed a User-Centered Design (UCD) approach, with a layer of compassionate, participatory design, given the sensitivity of the context, empathy, ethics, and accessibility.

The process was marked by difficulty accessing information and qualitative samples in the project’s early stages. We accepted this limitation and grounded the first prototype in rigorous secondary research and inference of mental models from the literature, to later contrast it with the community as soon as it was possible.


Secondary research.
Review of scientific literature, reports from patient organizations, and analysis of the digital ecosystem through benchmarking.

Synthesizing findings and insights.
Translating the evidence into UX artifacts: archetypes, empathy maps, a value proposition canvas, a patient journey map, and requirements definition.

Interaction and interface design.
Information architecture, design system, wireframes, and a high-fidelity prototype.

Closing, qualitative validation, and iteration
Focus group session with the CDG community and a final iteration of the prototype.

Discovery (Research)

Instrument design
I designed the semi-structured interview scripts and surveys for the two major user groups — patients and family caregivers on one side, and doctors and researchers on the other — prioritizing low-cognitive-load techniques appropriate for the selected target audiences.

Competitive benchmarking

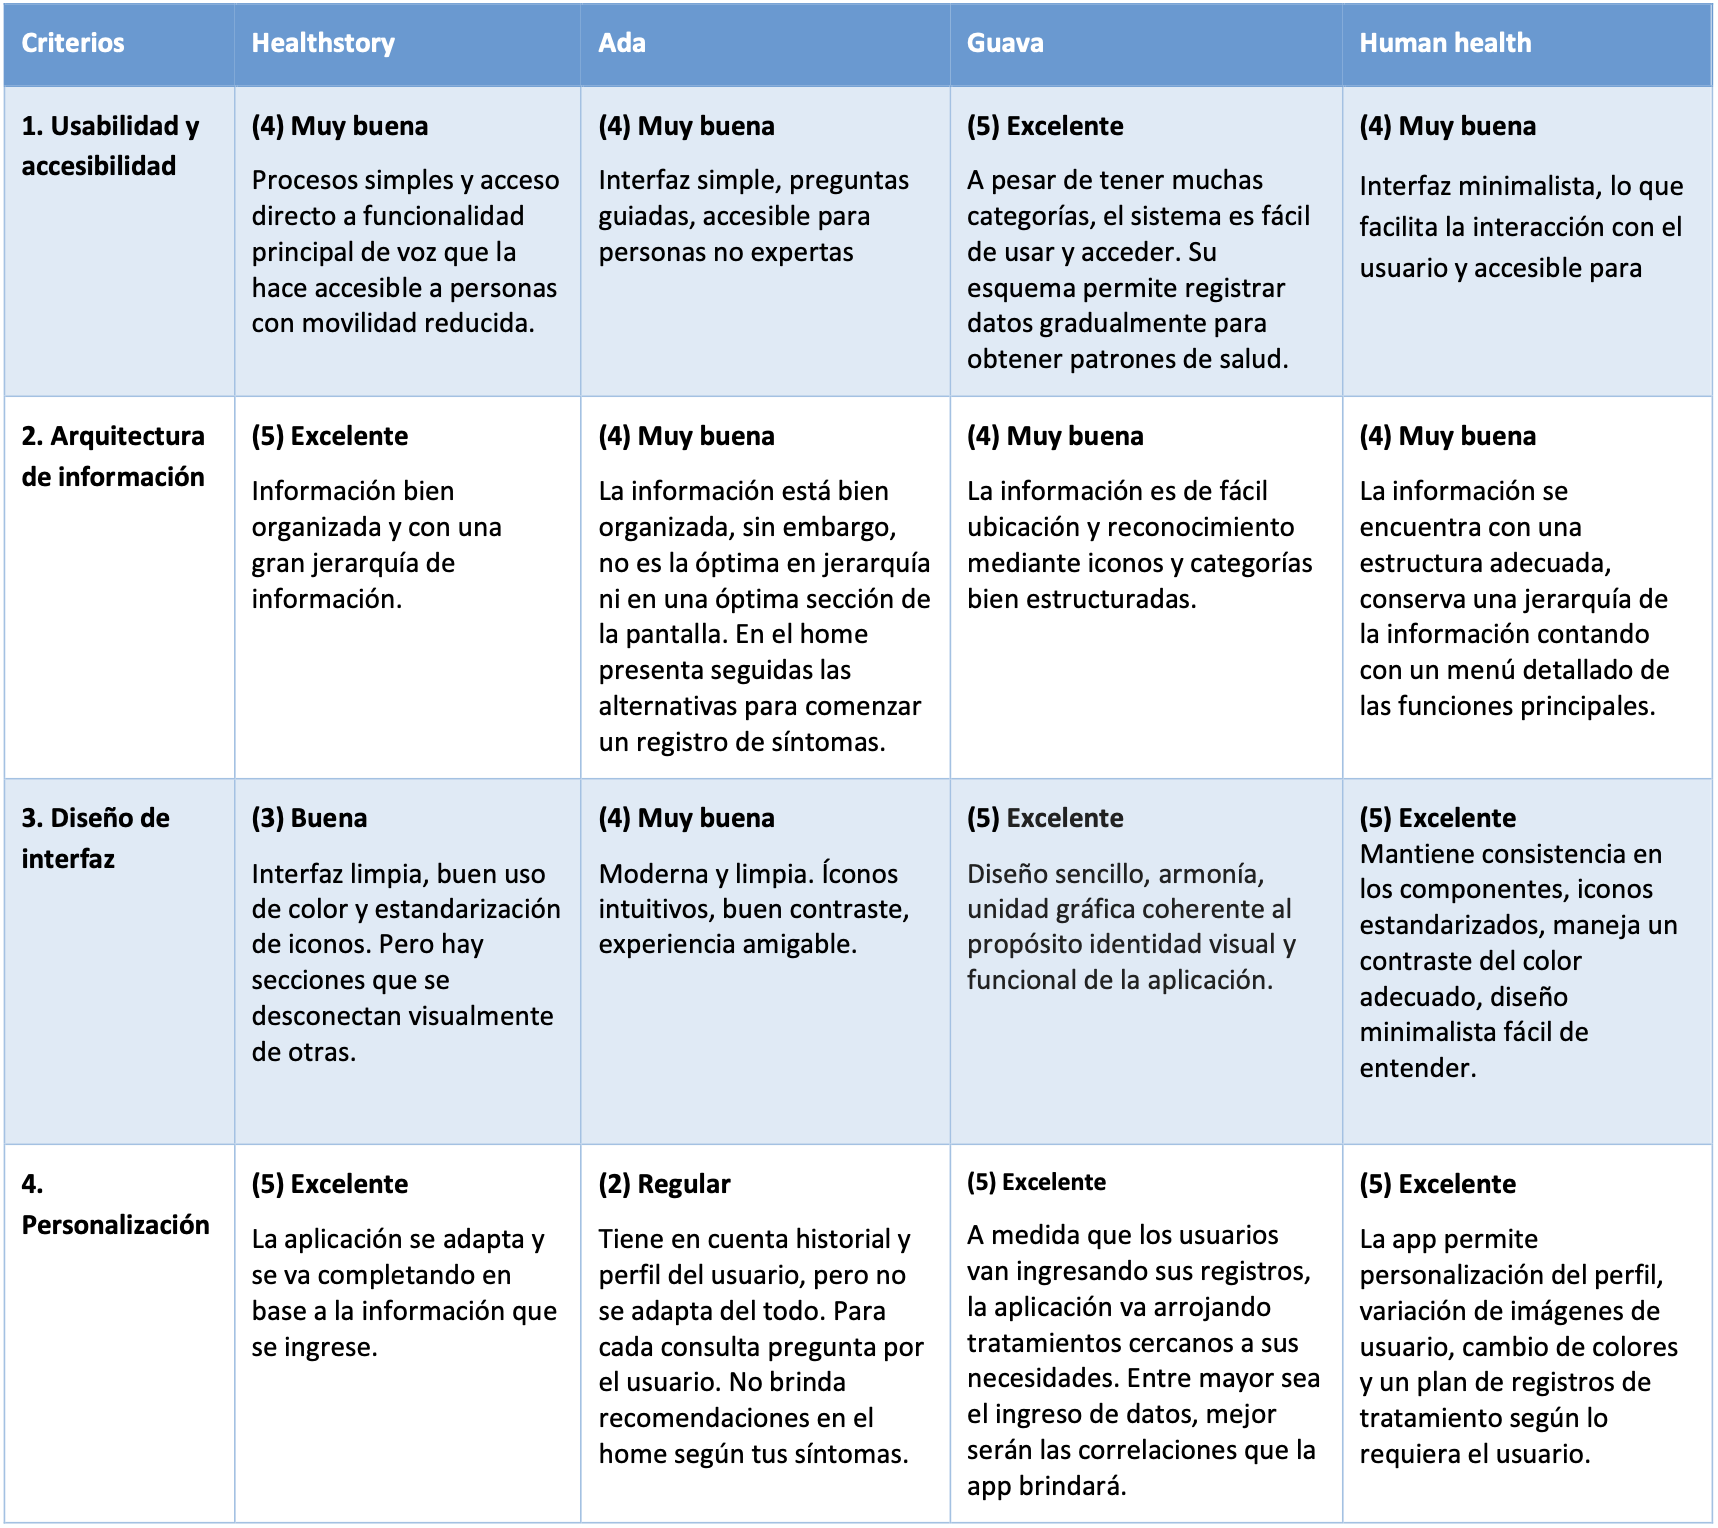
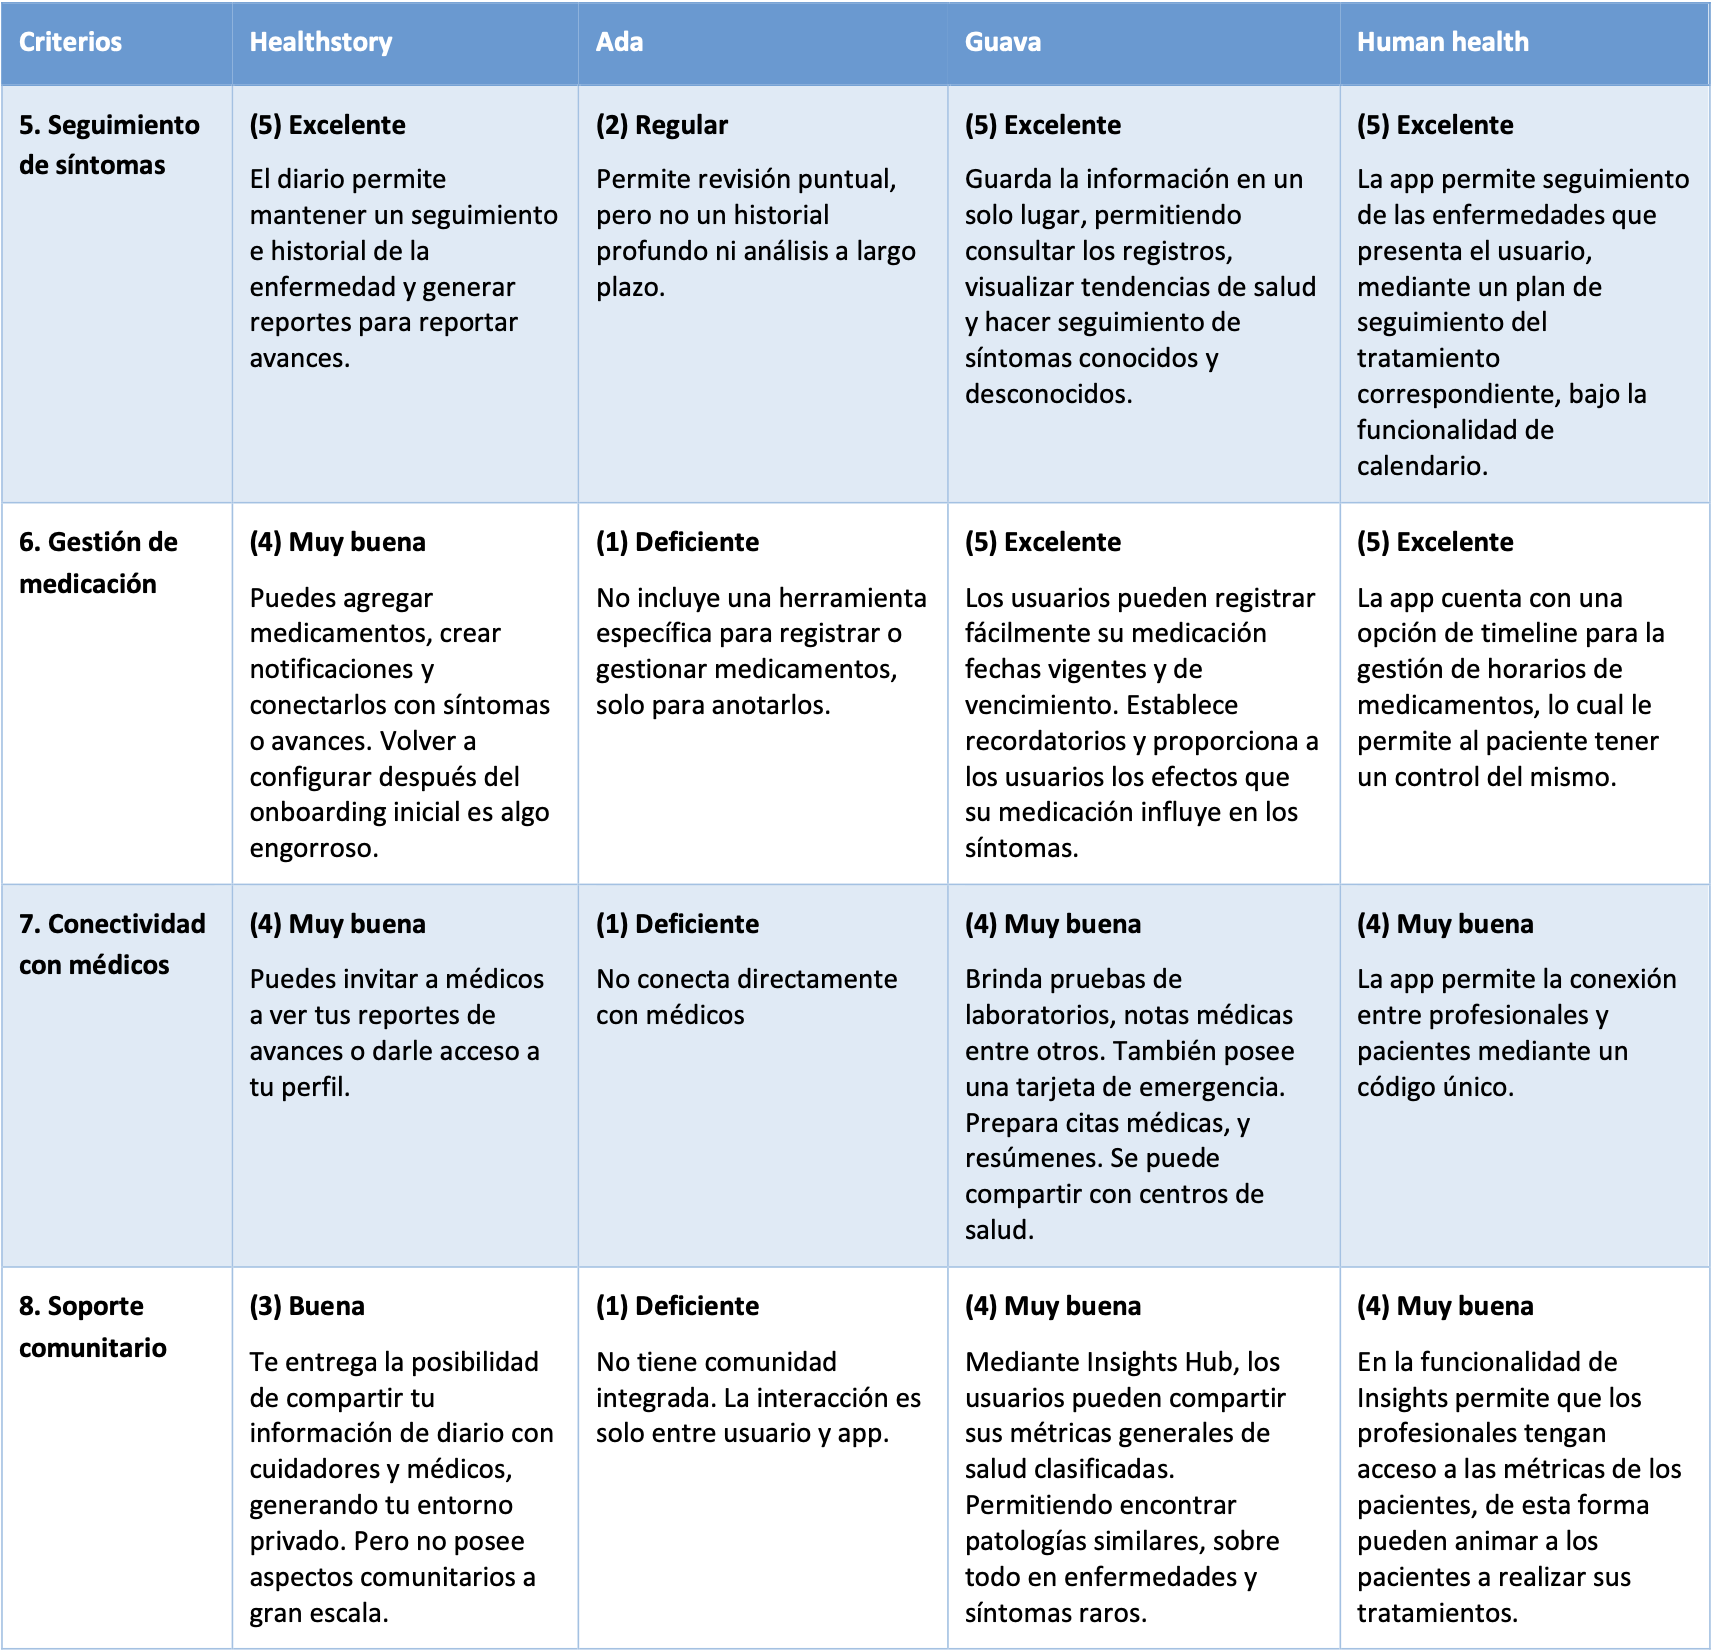
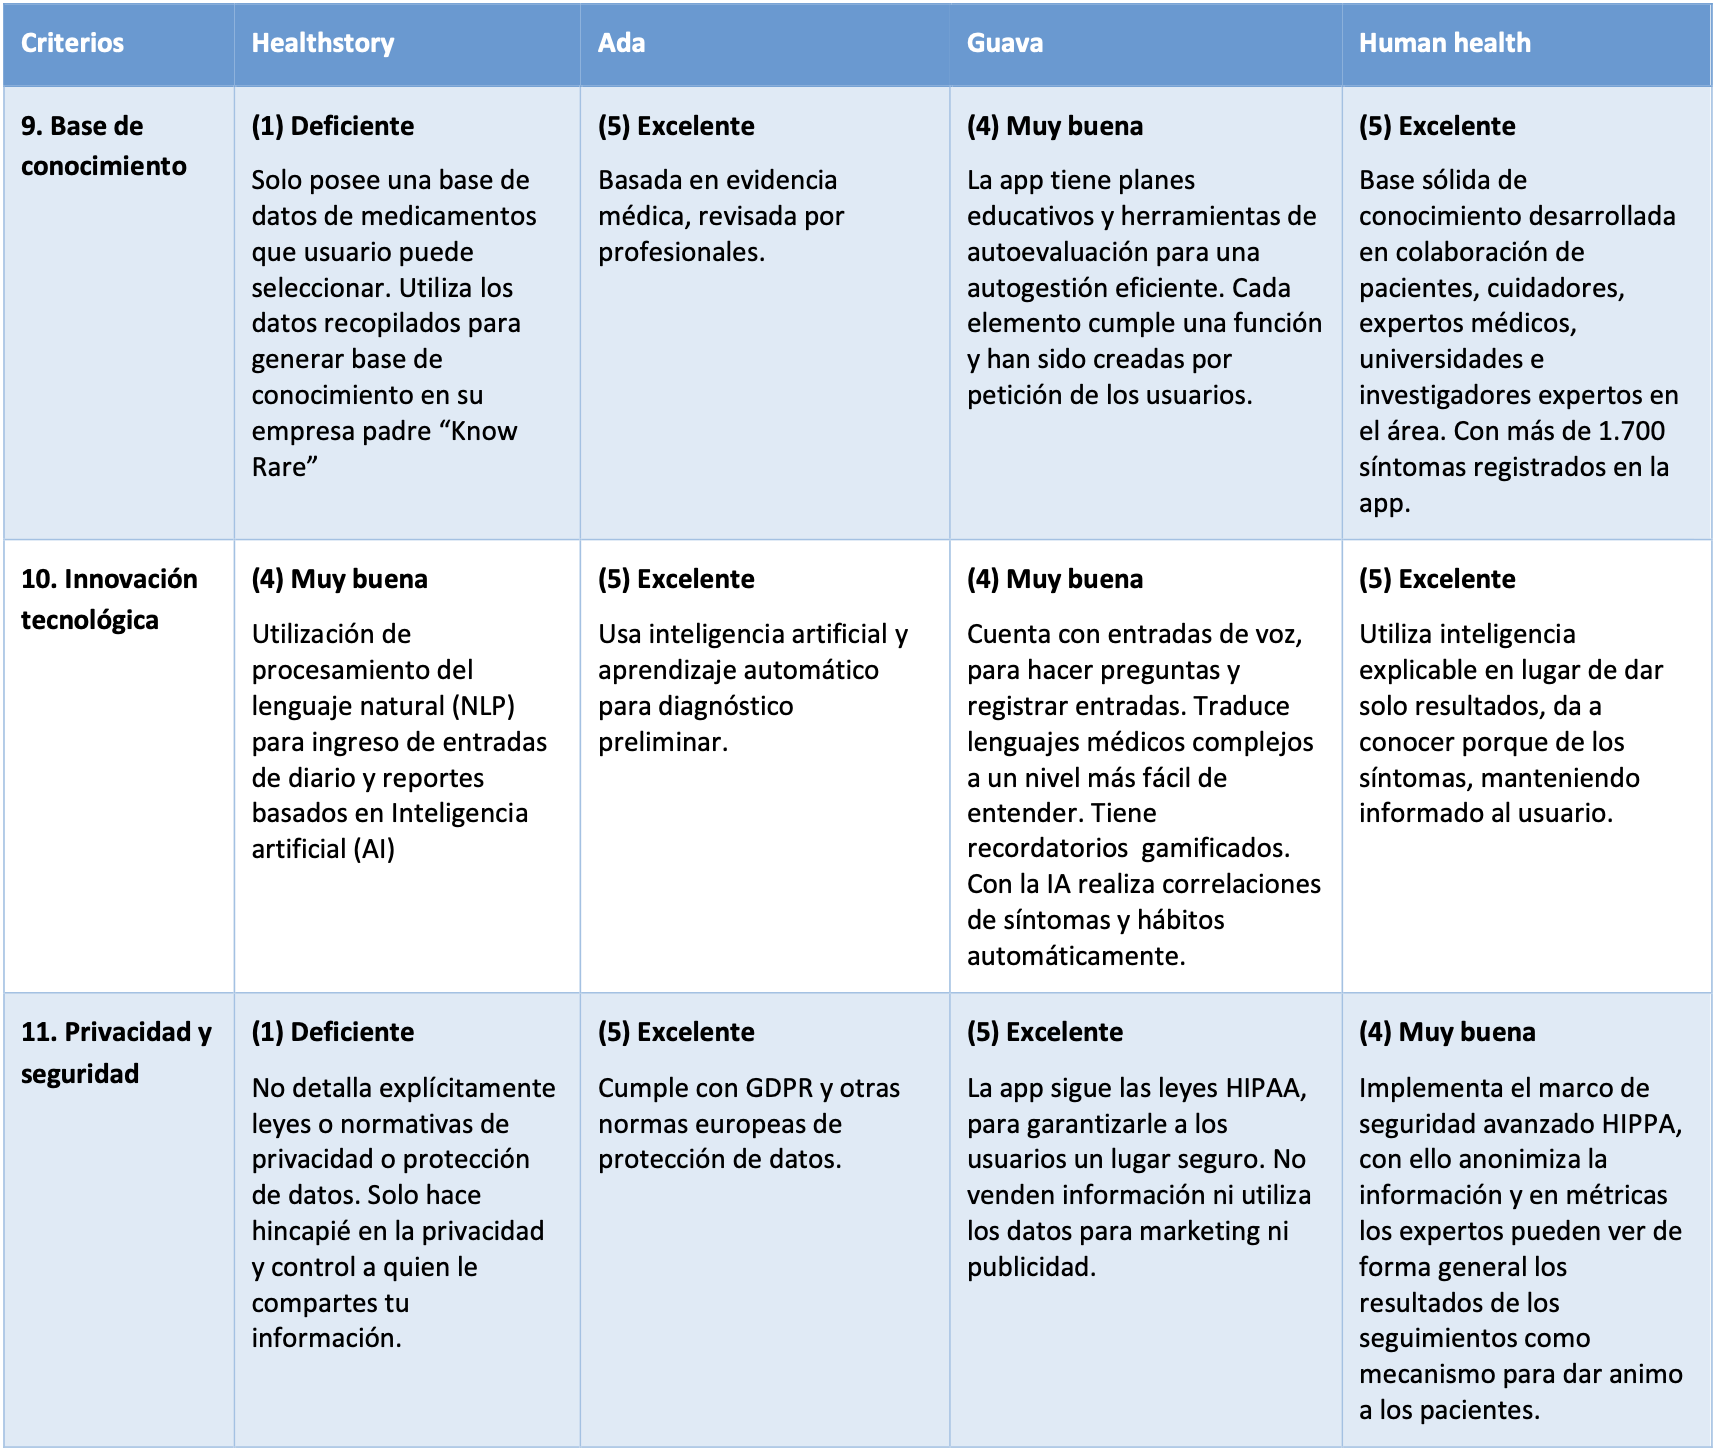
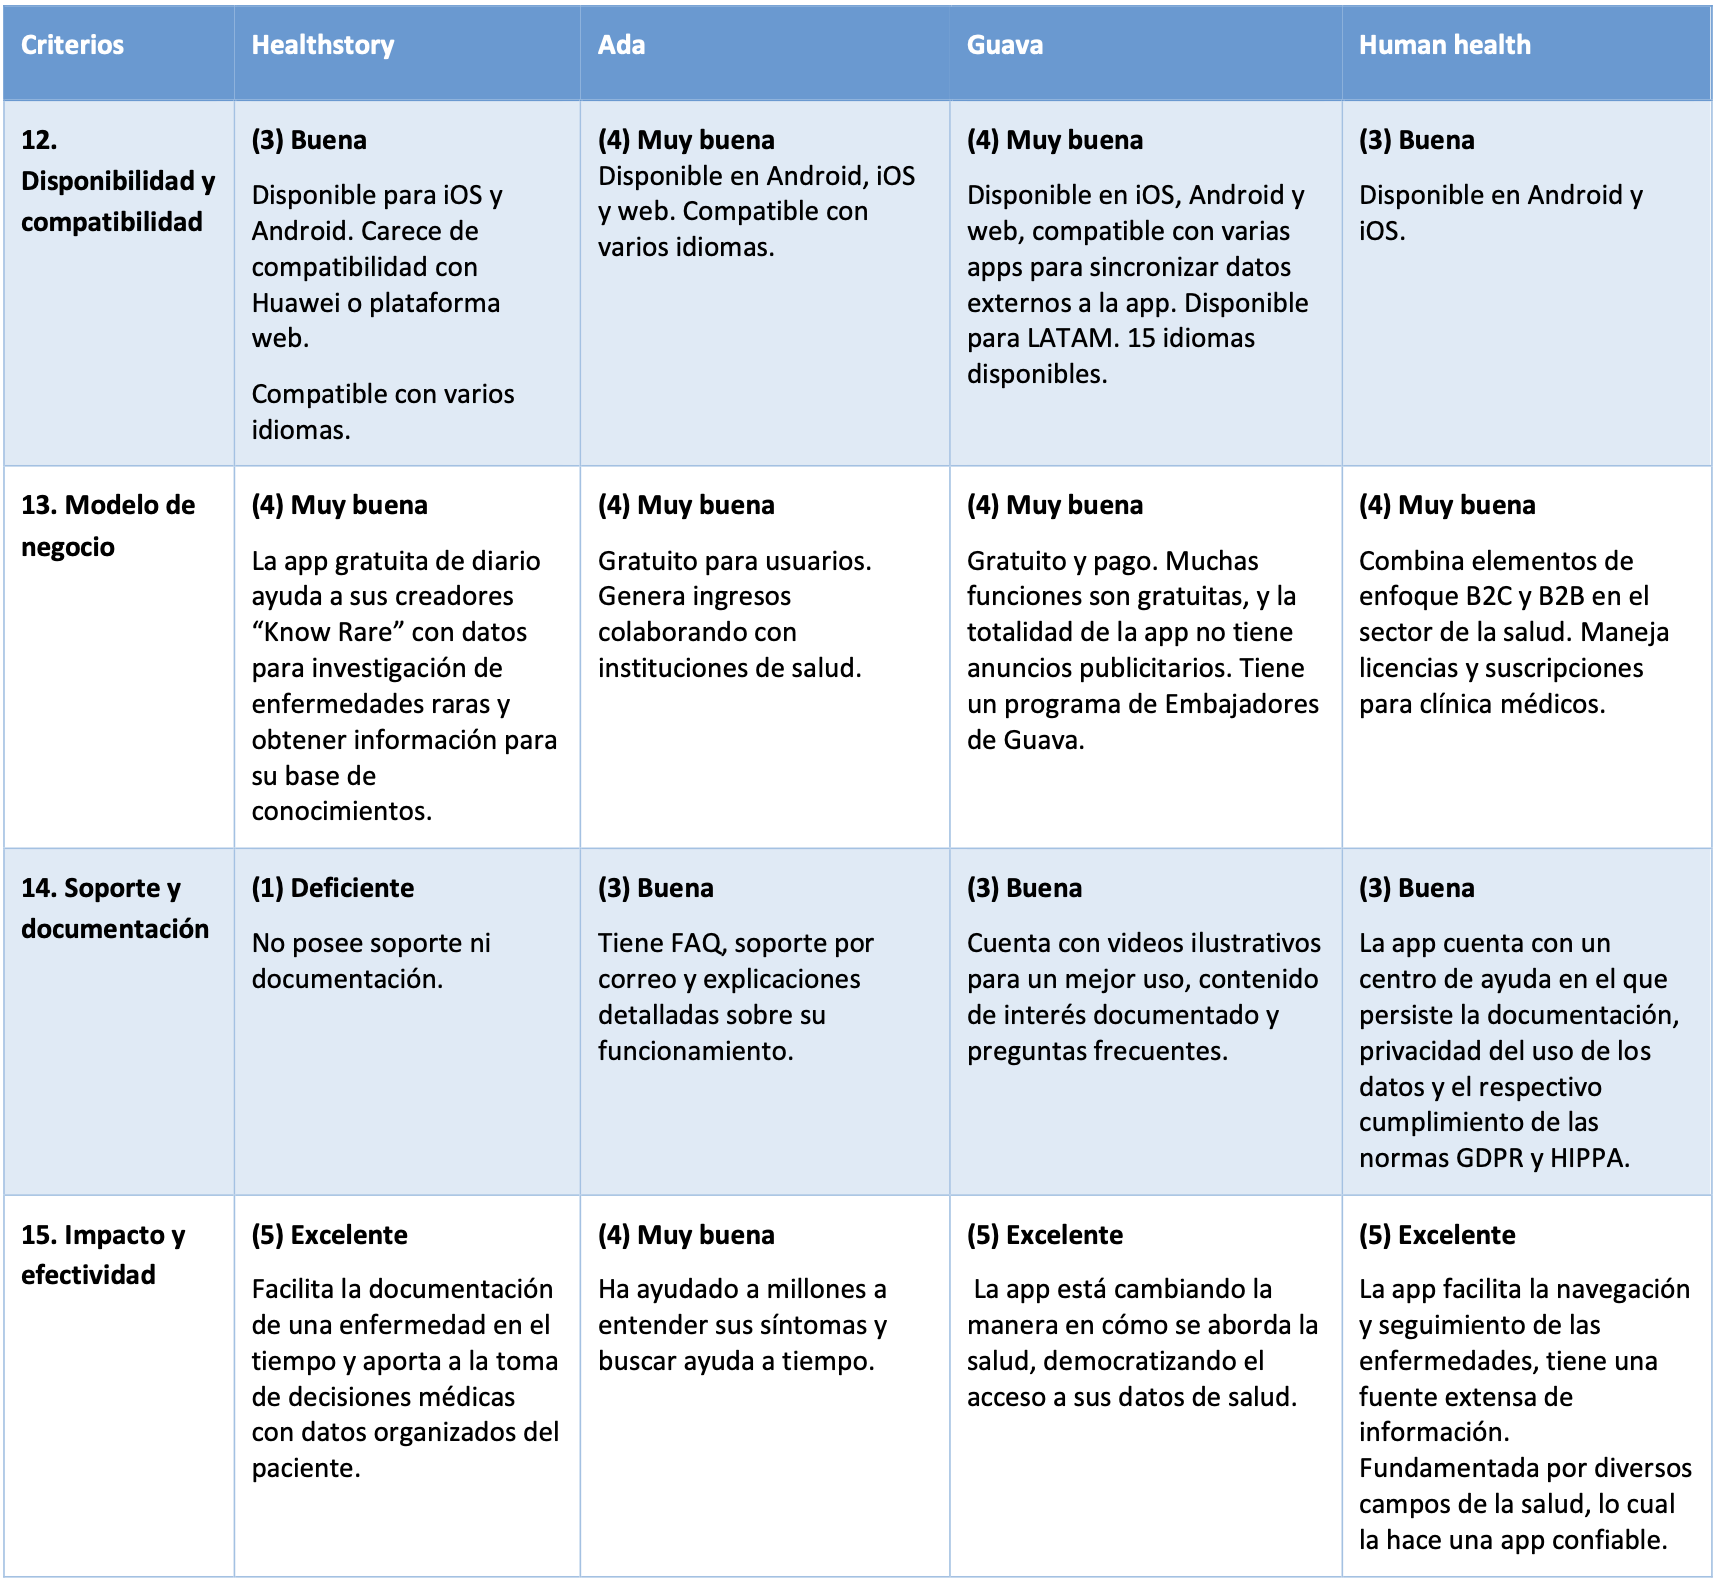
I analyzed four reference apps in digital health, selected through market research on the App Store, Google Play, and the web: HealthStoryAI, Ada, Guava, and Human.health.

I defined 15 criteria grouped into four categories (User Experience, Key Features, Value Proposition, and Technical and Commercial Aspects) and scored them on a 1-to-5 scale after installing and using each app.

Results (highest to lowest score):

  • Guava 66 pts.
    A comprehensive habits-and-symptoms tool with a holistic brand vision. The most complete in the analysis.
  • Human.health 65 pts.
    Explainable algorithms, medical collaboration, and patient empowerment. The most consistent.
  • HealthStoryAI 52 pts.
    Voice logging (NLP), ease of use, and appointment prep. Weakness: privacy and support.
  • Ada 49 pts.
    Collaborative knowledge base and symptom checker. Weakness: no medication management, no connection with professionals, no personalization.

Criteria applied and analyzed

Benchmark conclusion
No single solution covers every need in tracking rare diseases. The opportunity was in combining the best of each into a coherent proposal. From this we produced design recommendations that would shape the product: reducing cognitive load, multimodal input (voice, text, photo, video, selection), high accessibility, role-adapted onboarding (patient/caregiver/doctor), alerts, medical access to history, a support community, a validated knowledge base, AI for pattern detection, and data standardization/translation.

Synthesis and insights

We systematized the evidence into a synthesis matrix that ensured traceability between each source and each design decision. The selected thematic axes were:

  • Clinical/epidemiology
  • Diagnosis and follow-up
  • Psychosocial impact
  • Needs and pain points
  • Digital solutions


There’s no such thing as a “type of patient”
The CDG experience is ever-changing and non-linear, so we had to avoid rigid personas and use flexible tools for representing users.


The main need isn’t more information — people want content that’s easy to understand, accessible, and verified.

Archetypes, empathy maps, and value propositions

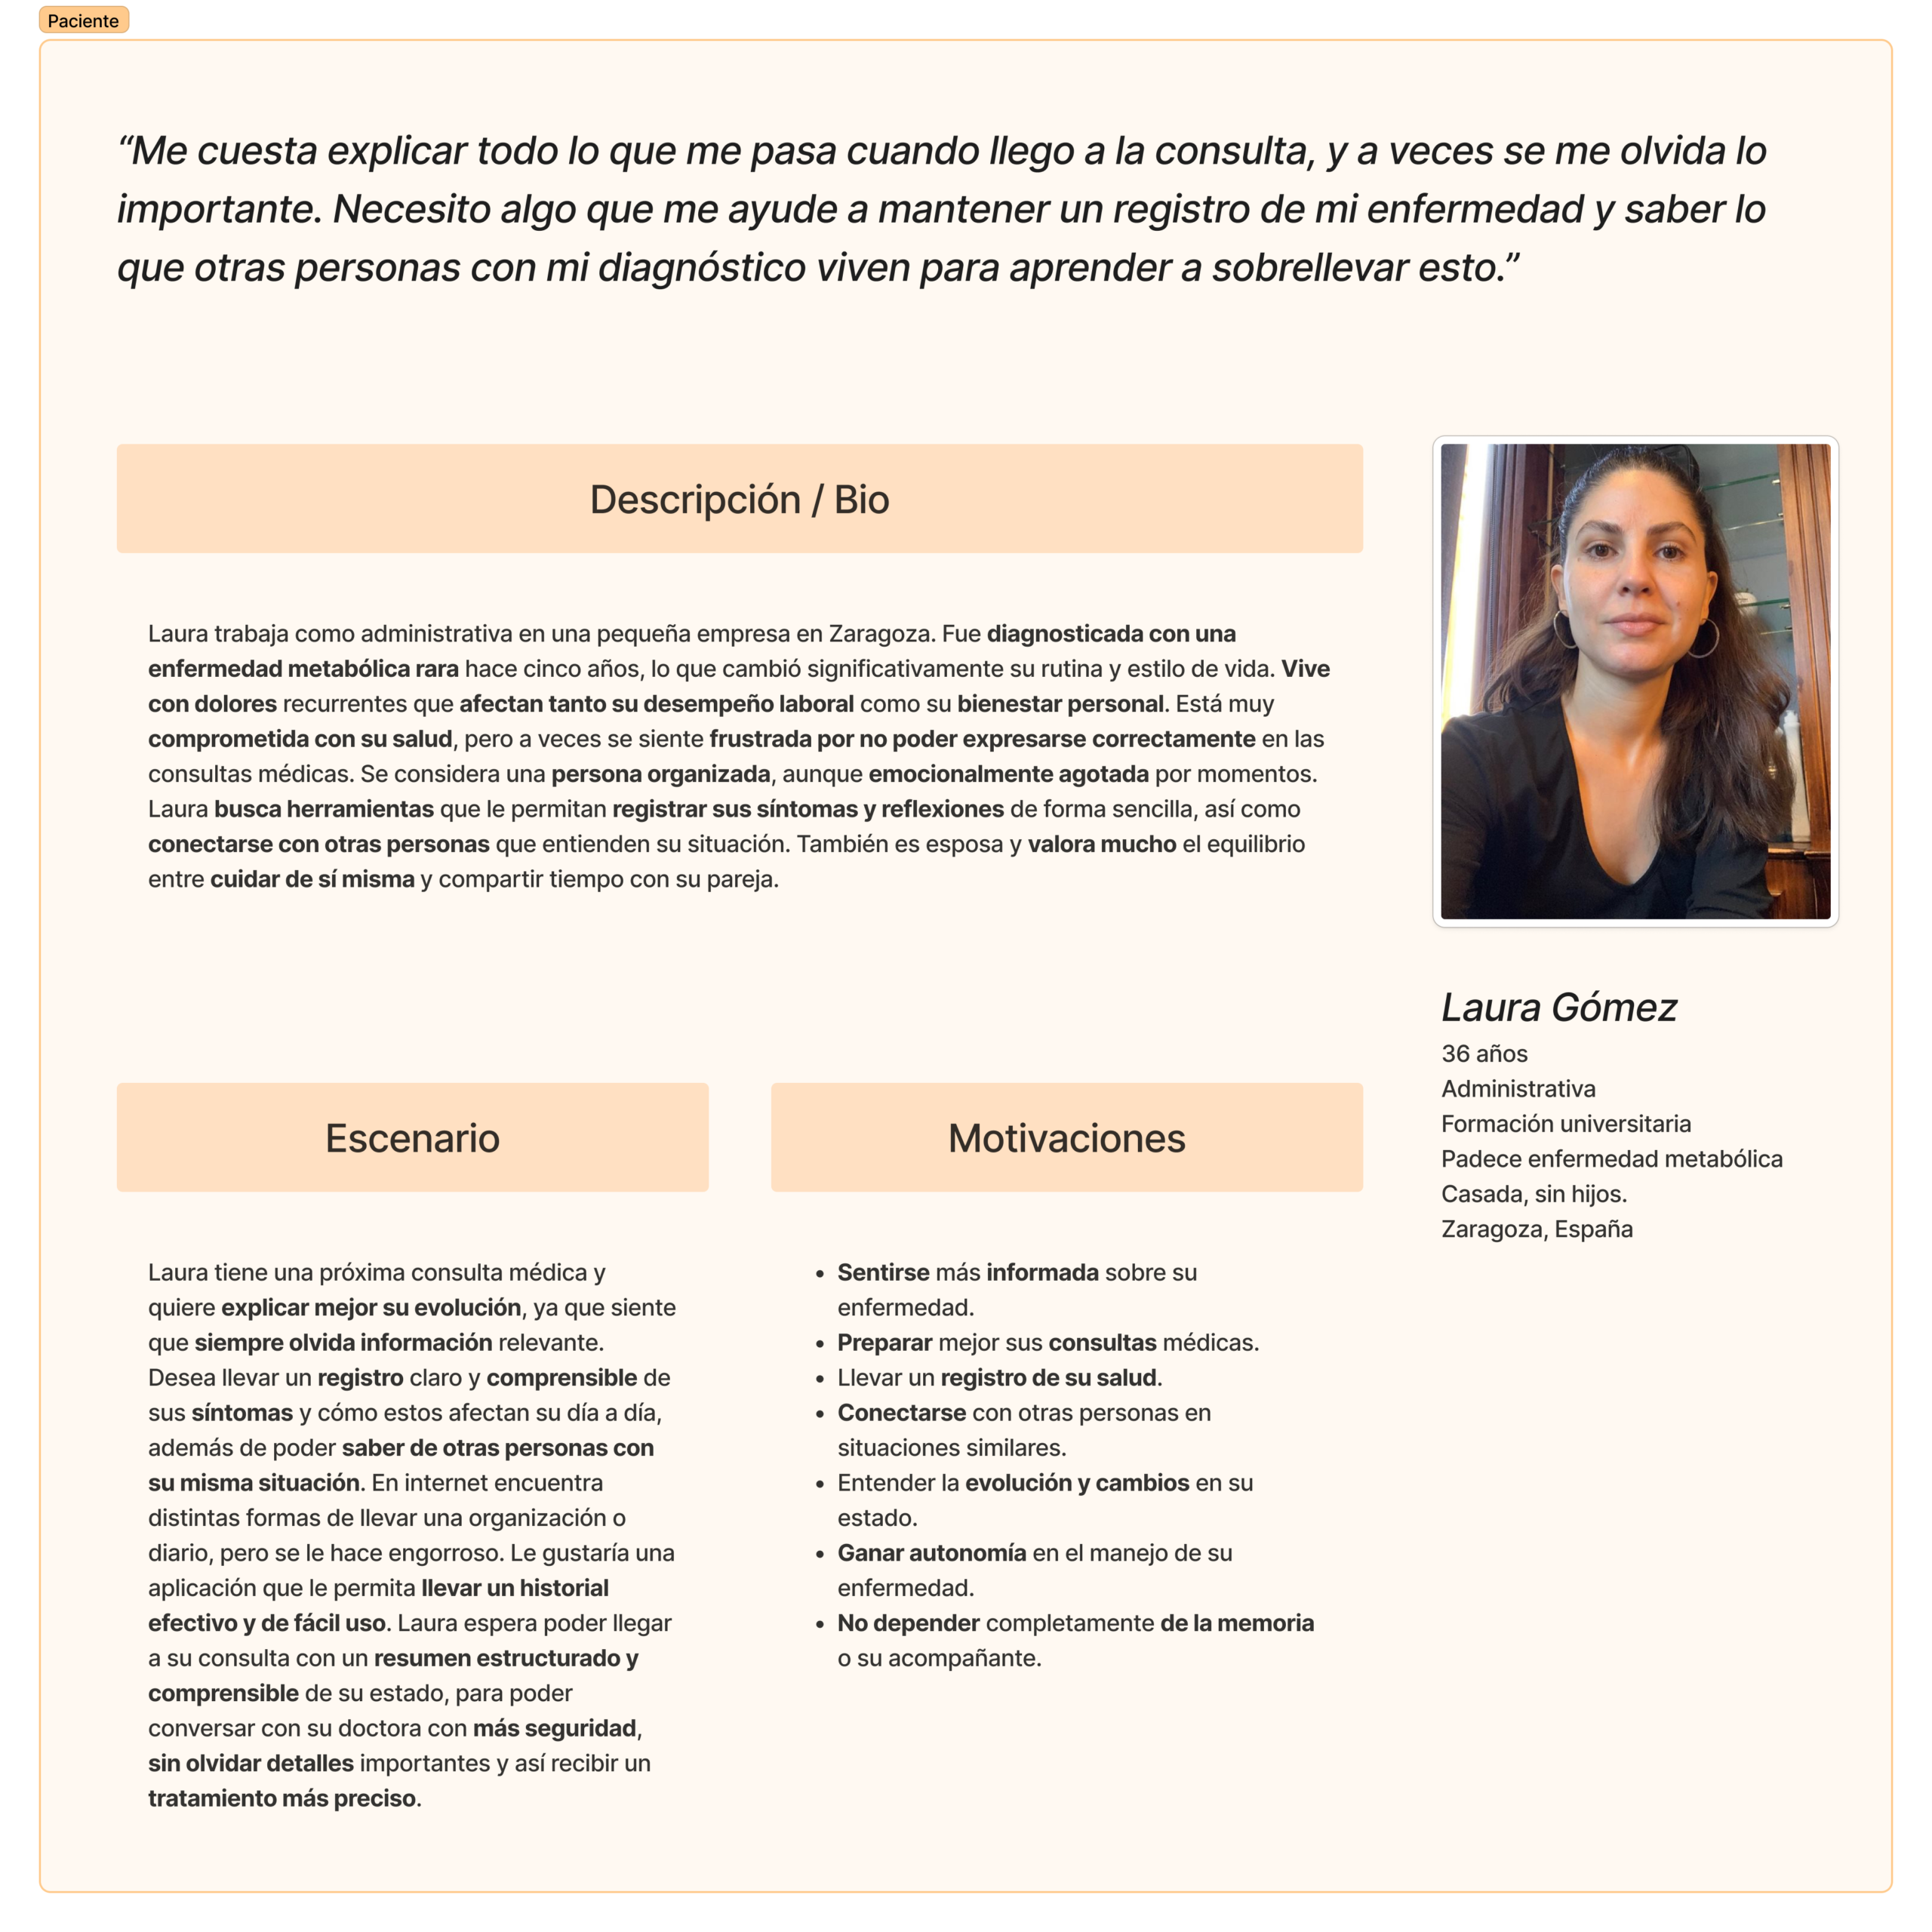
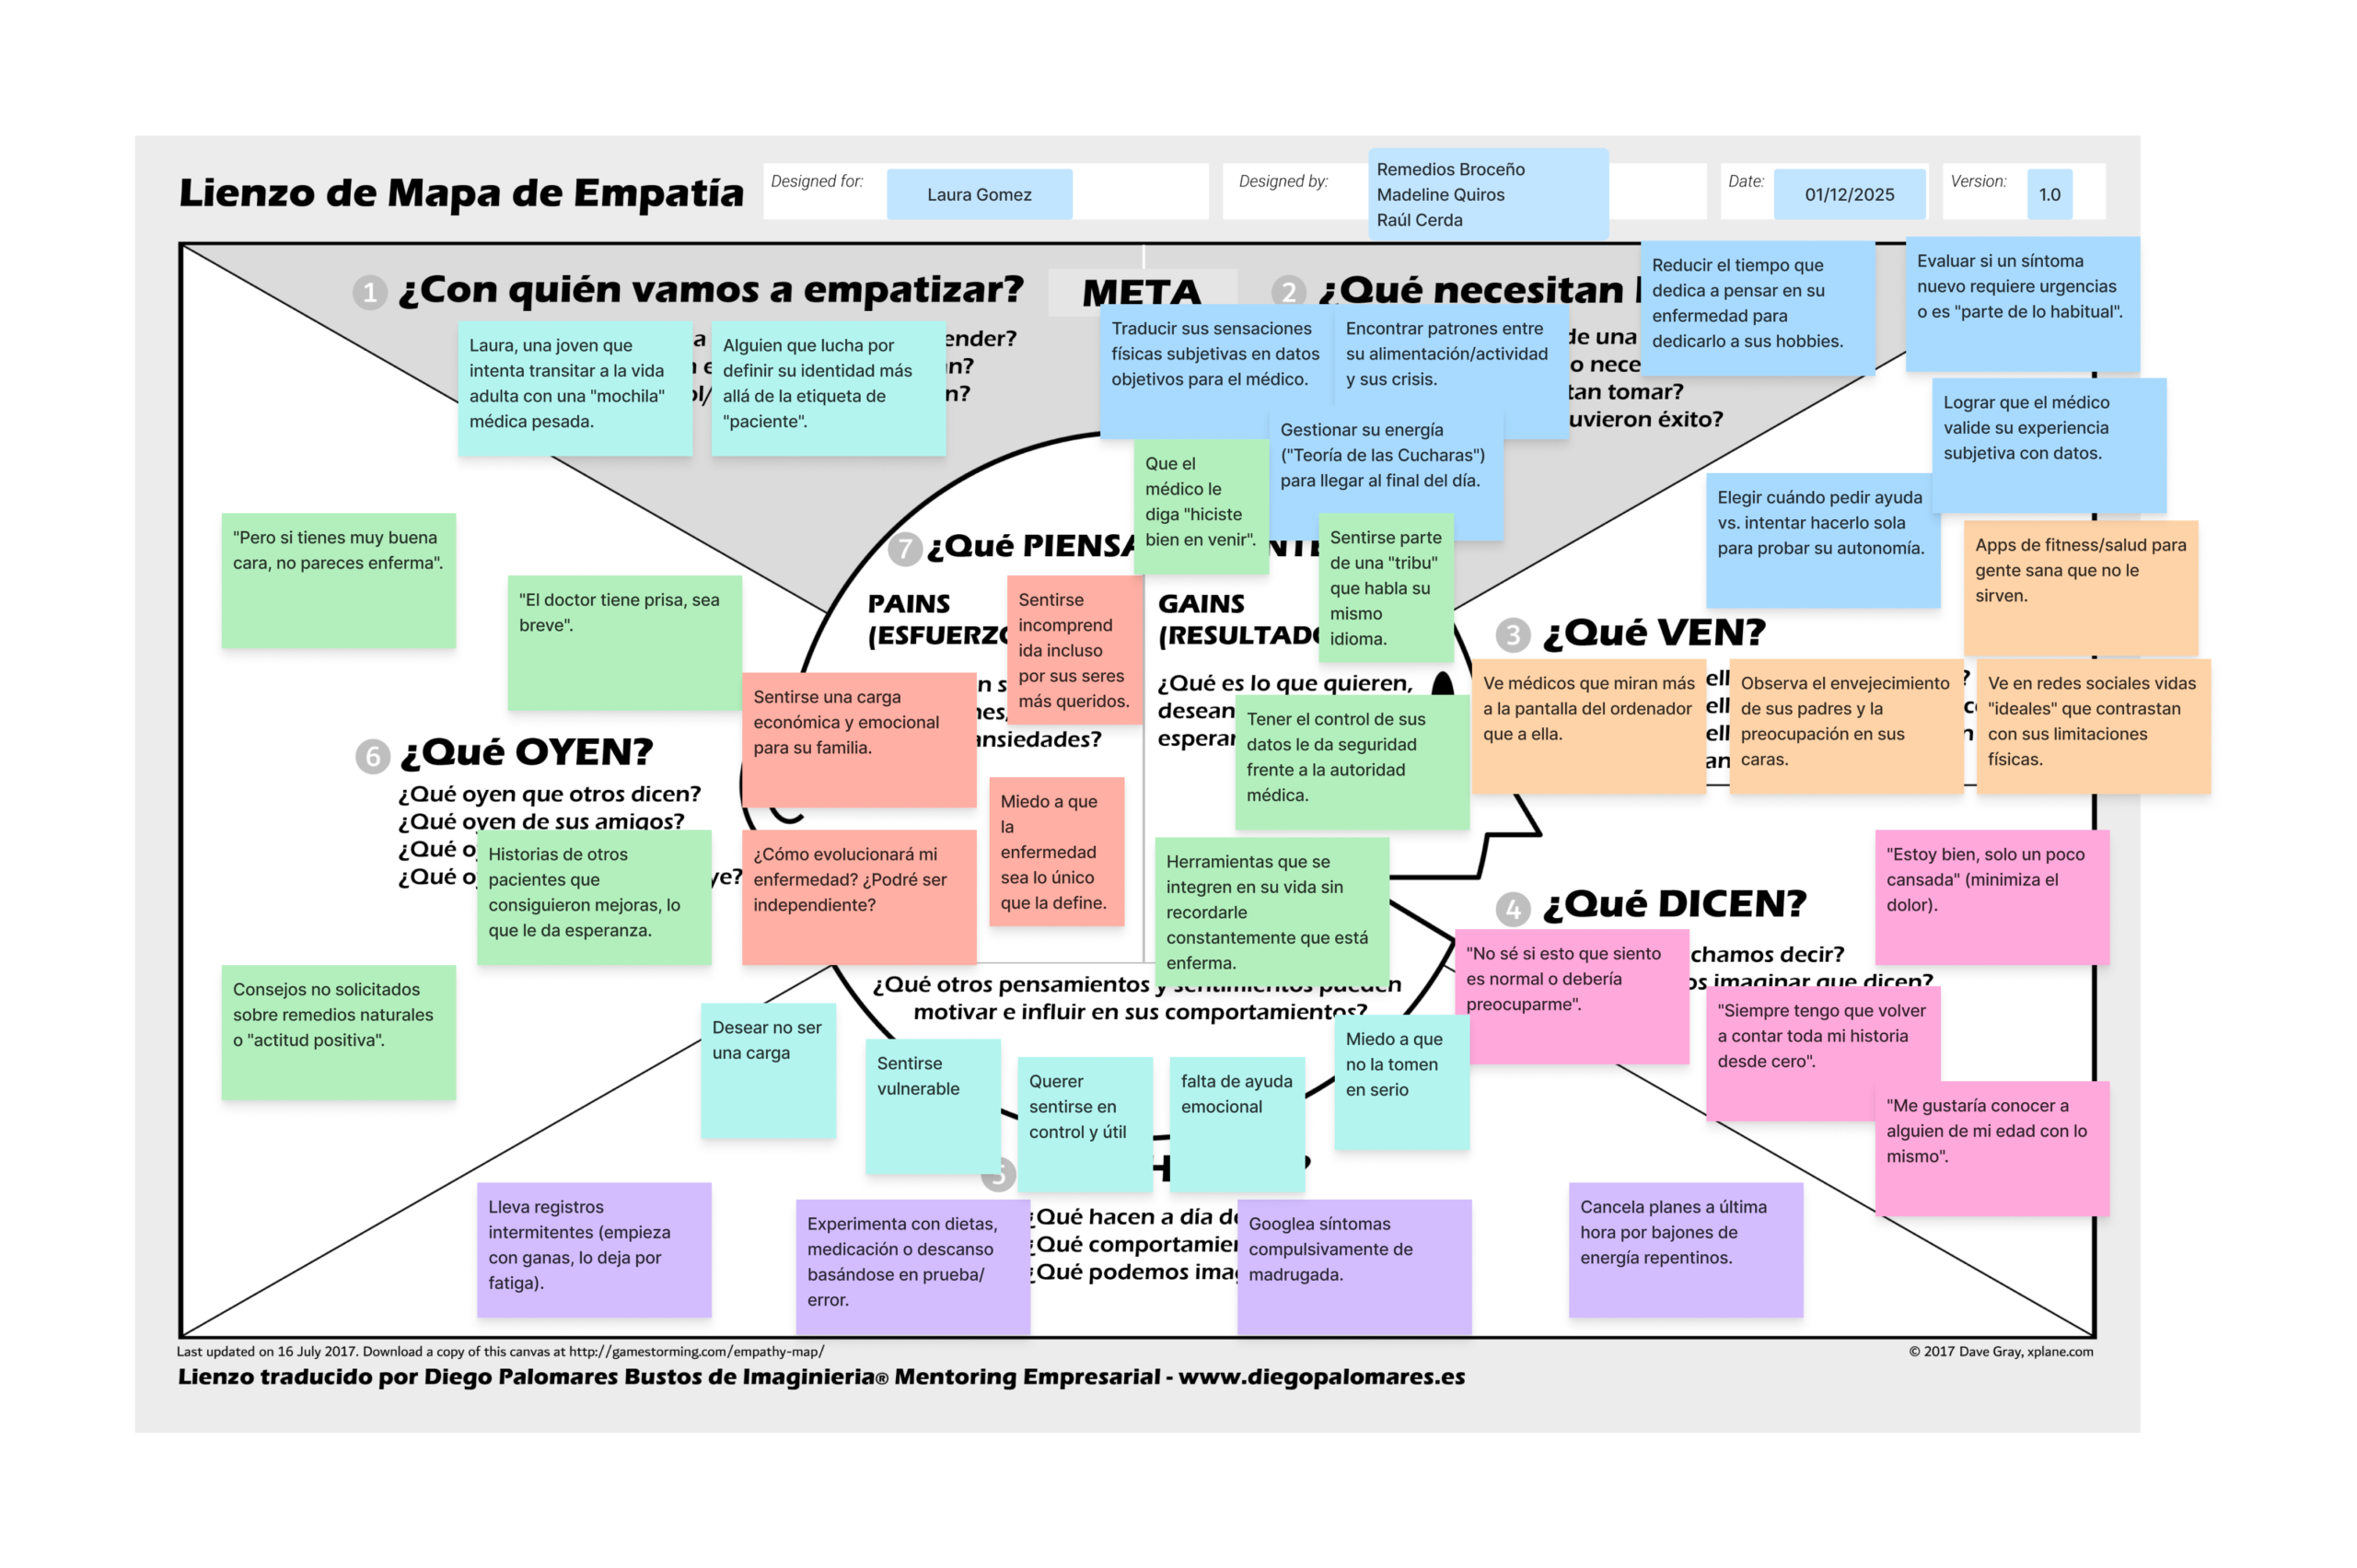
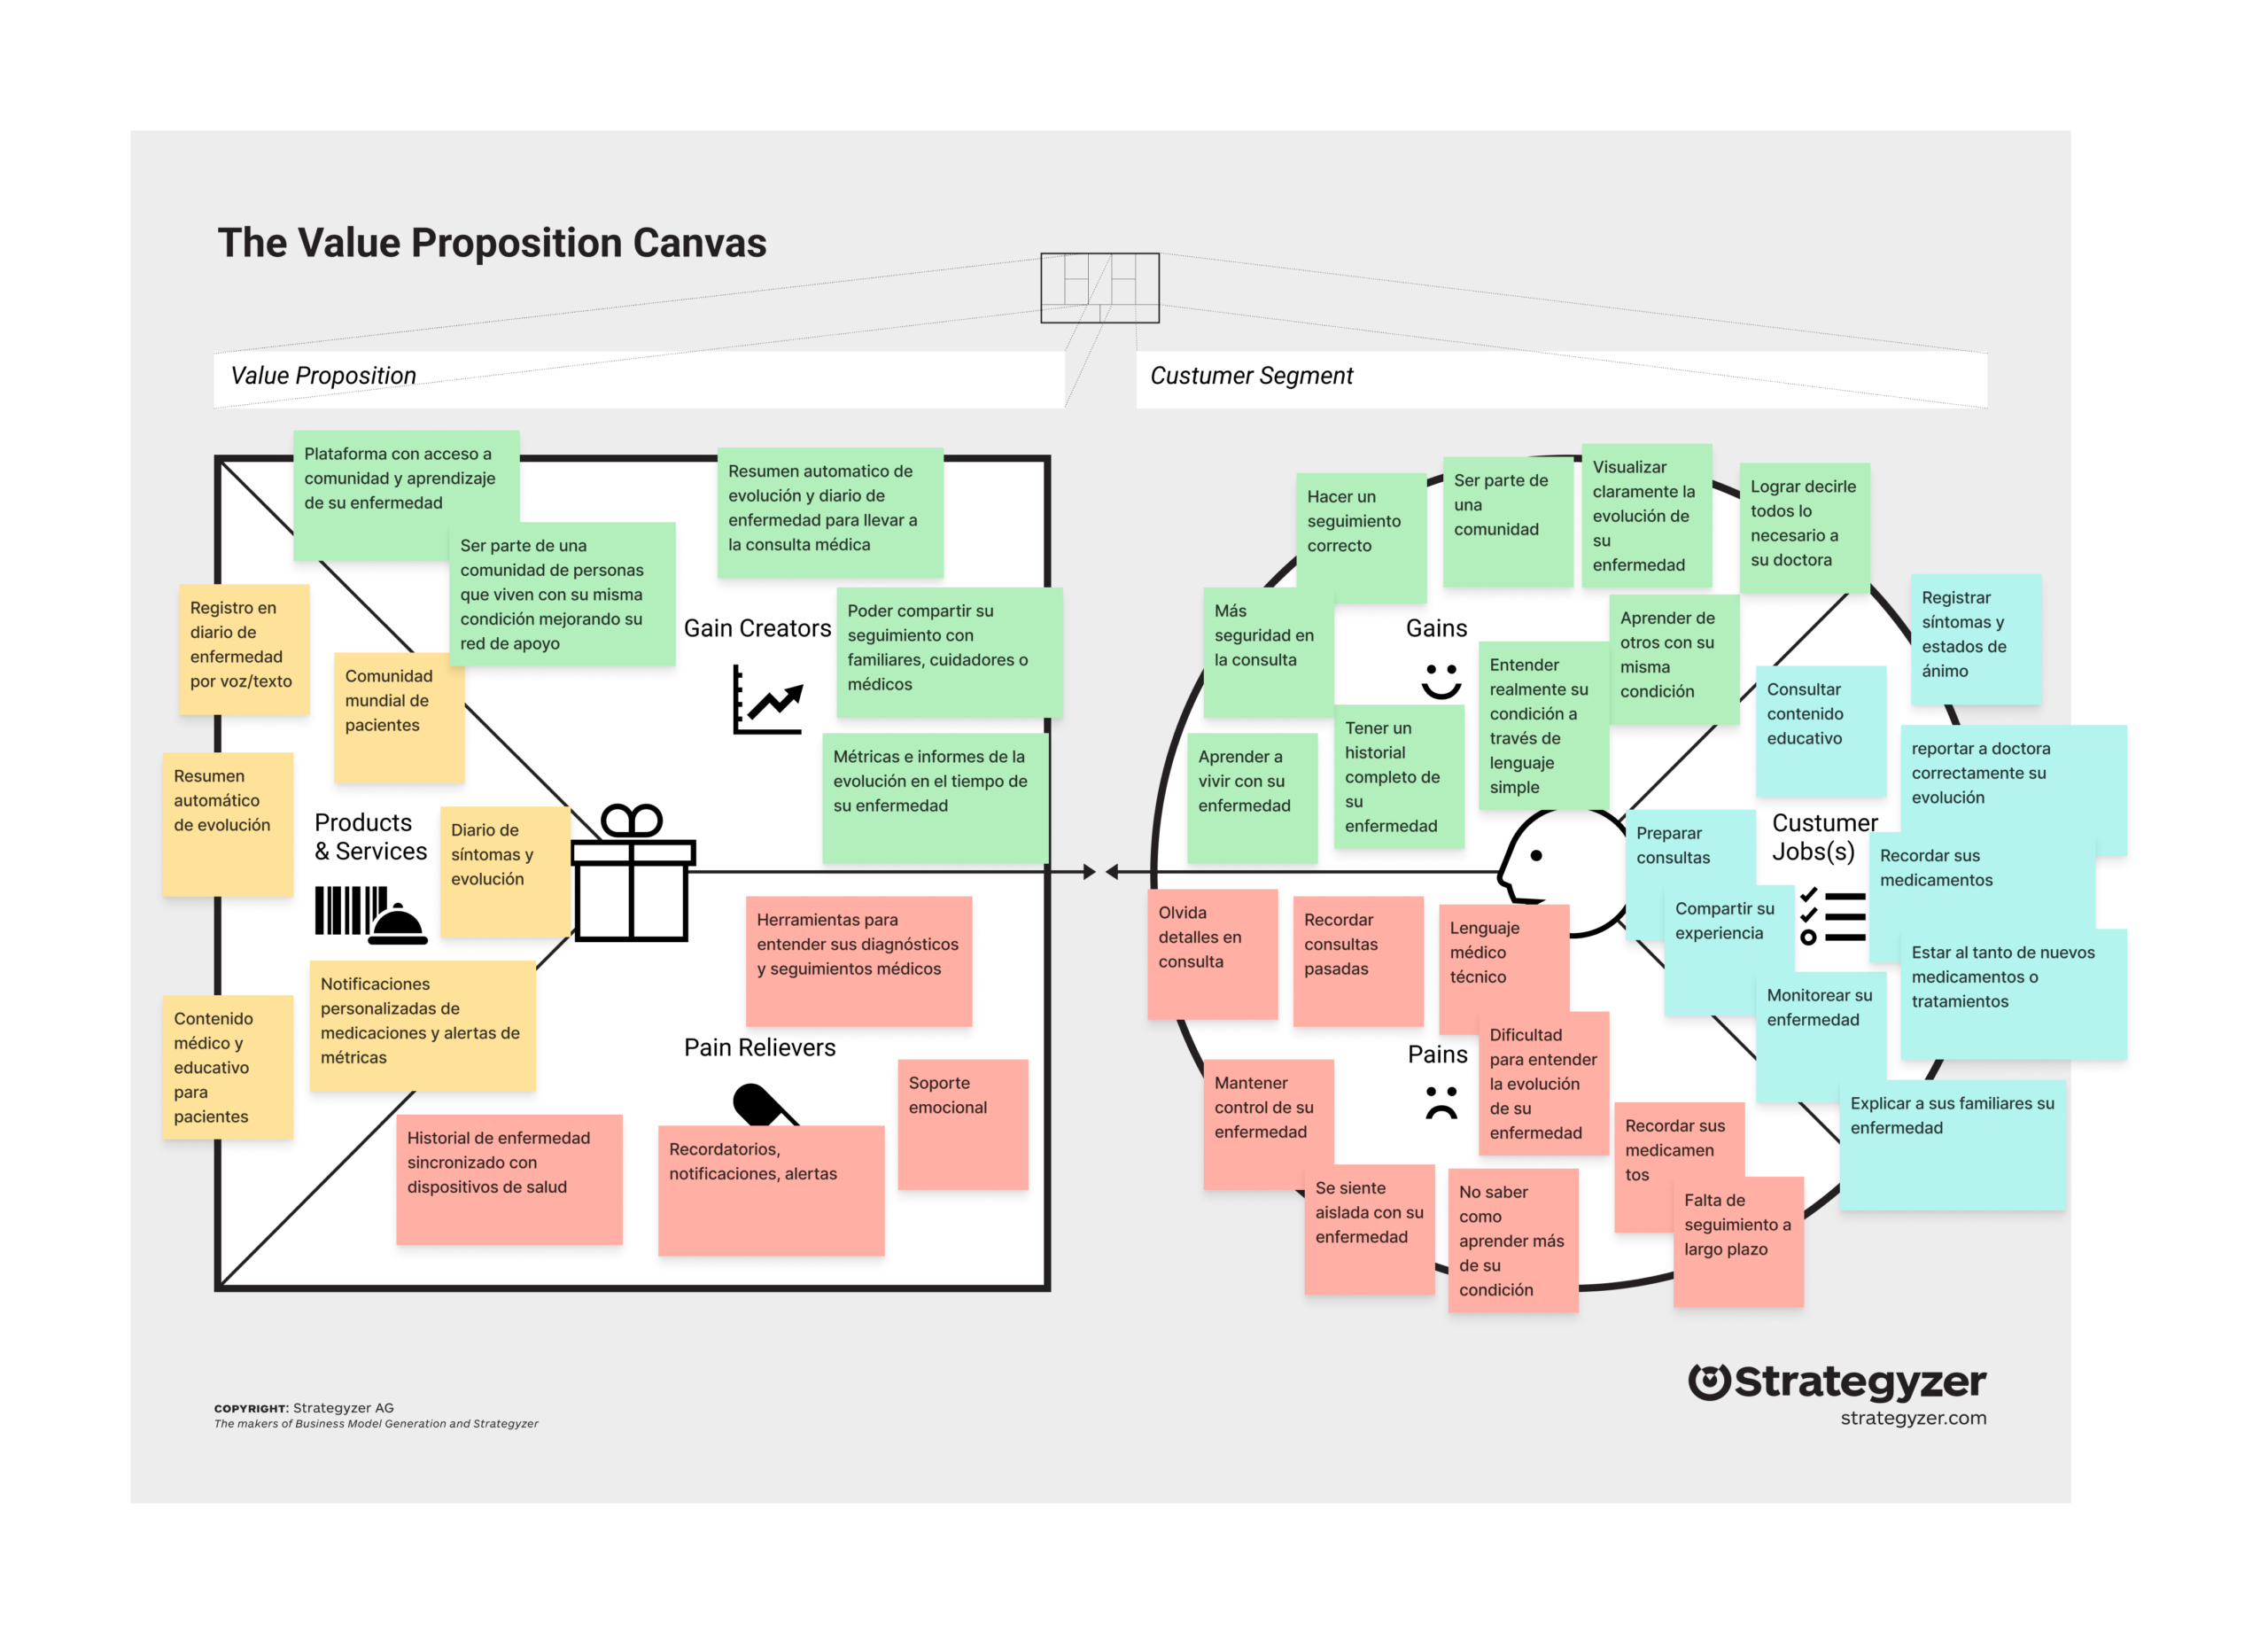
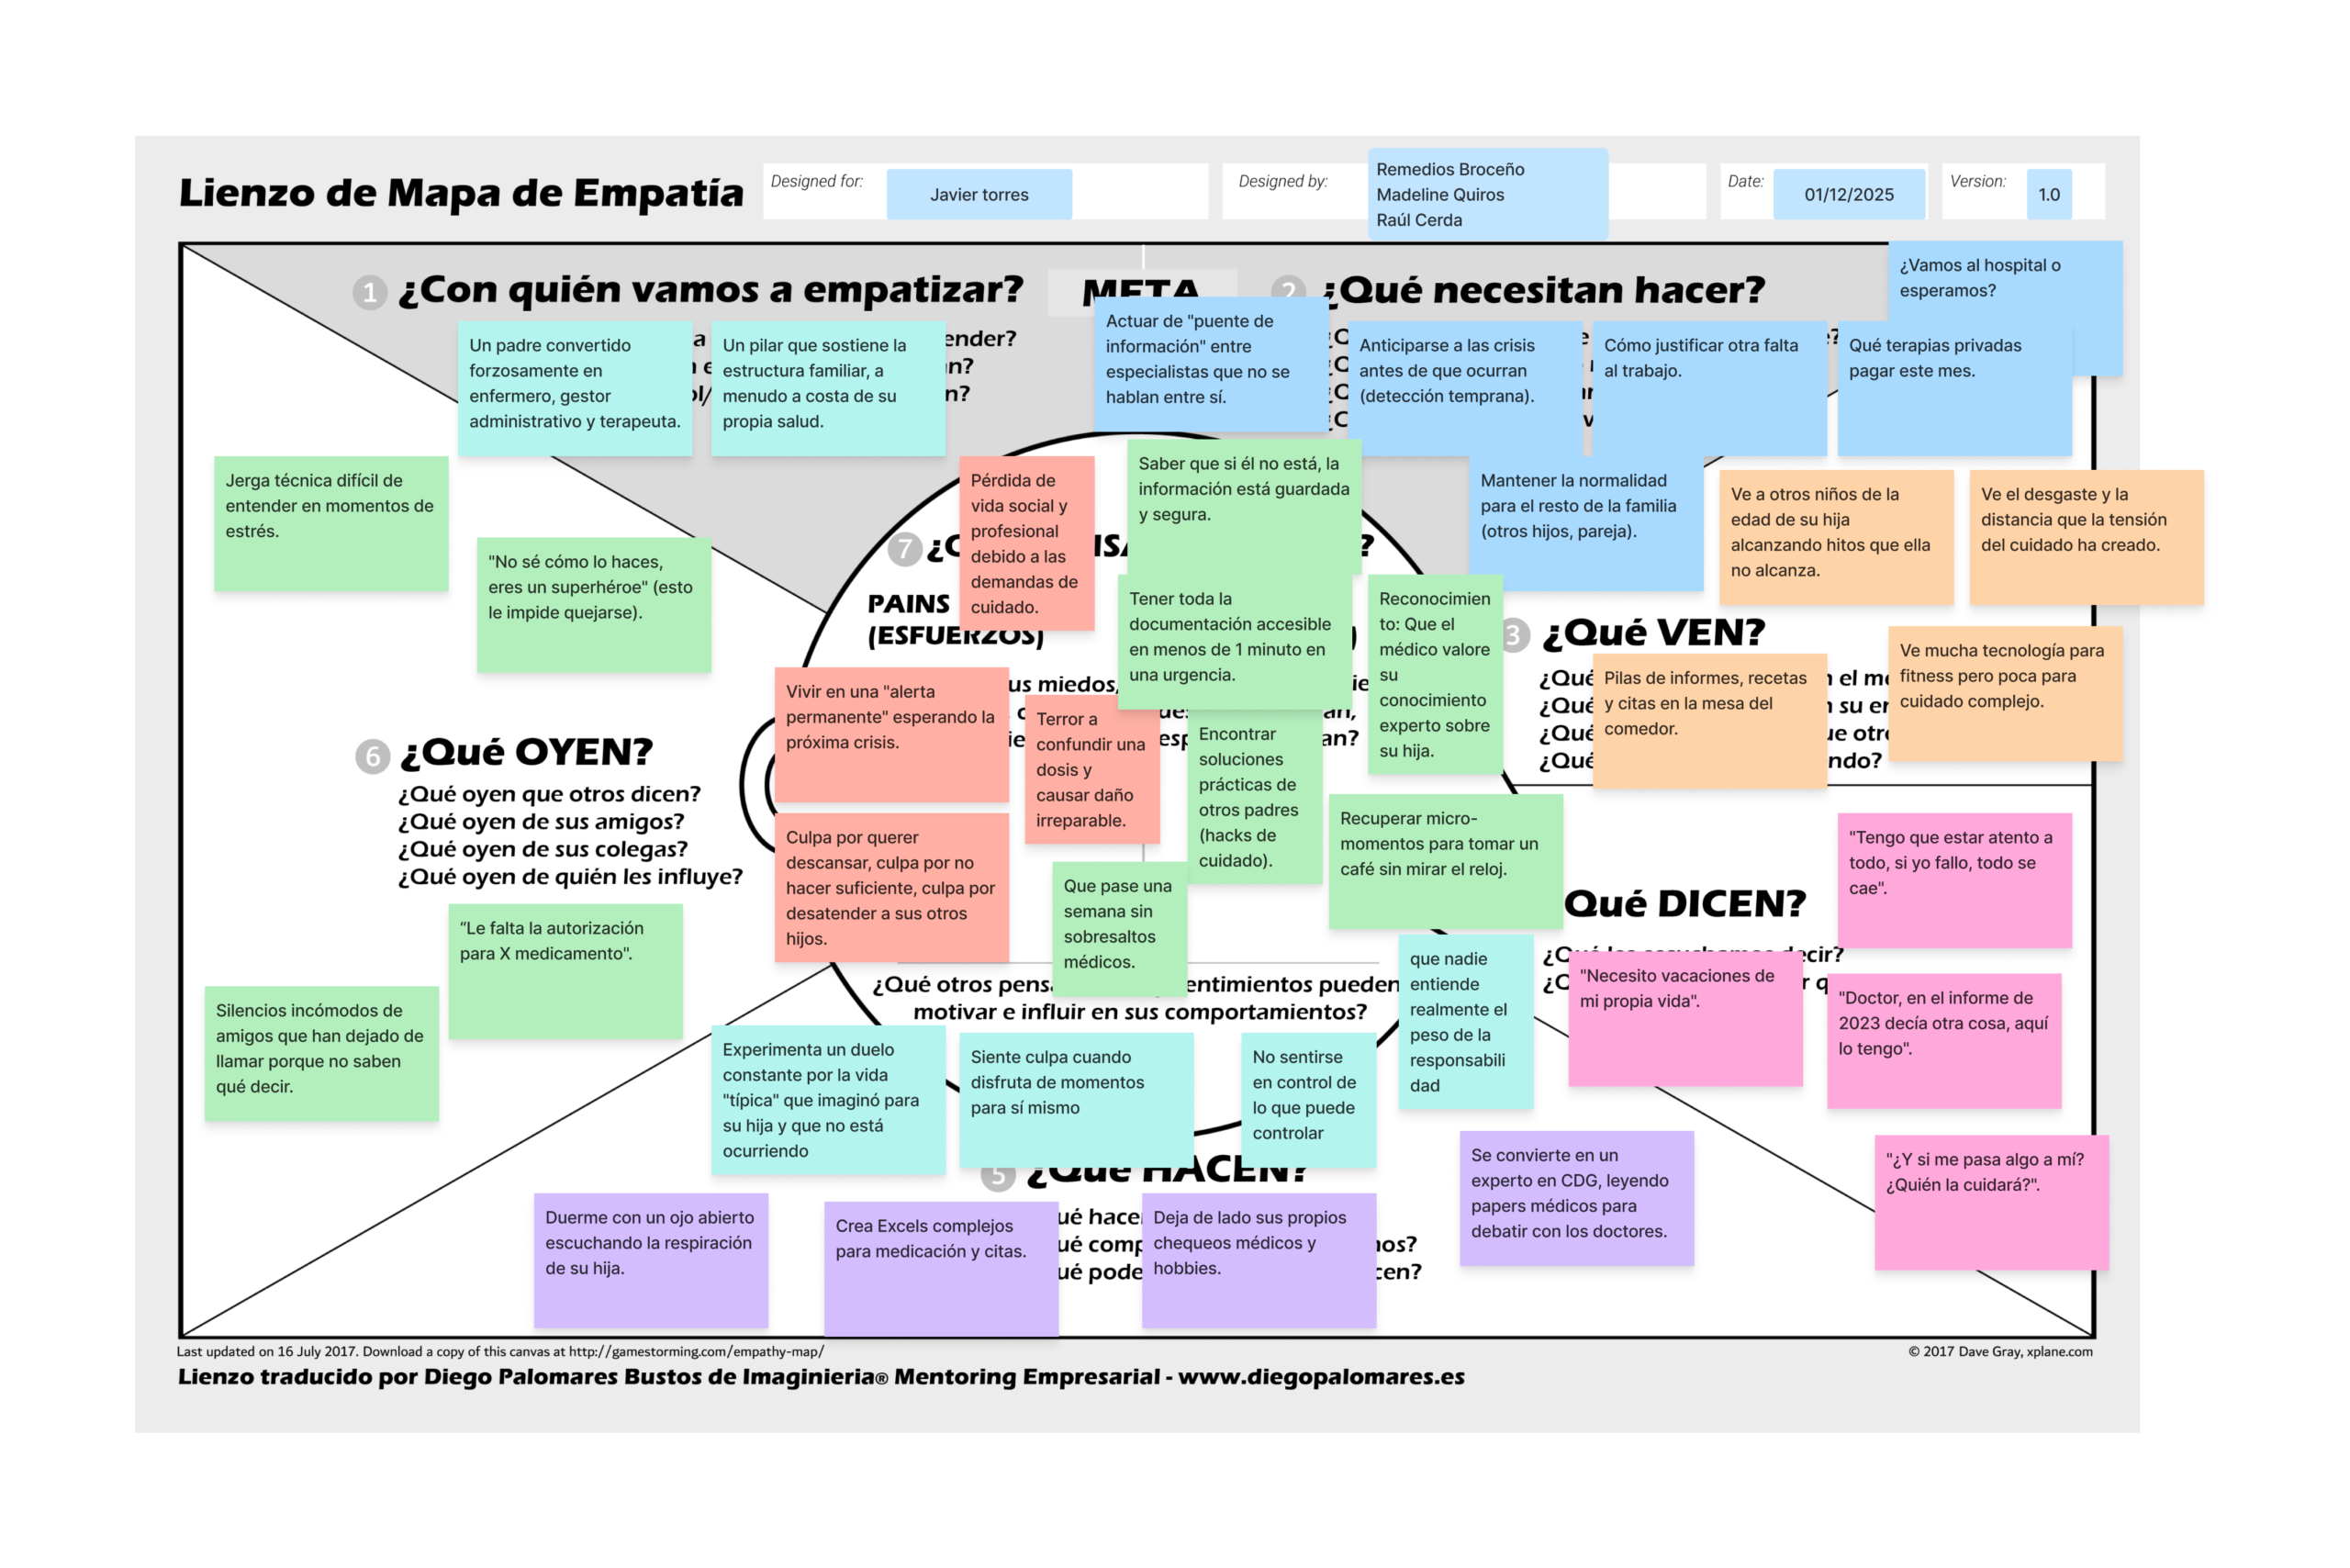
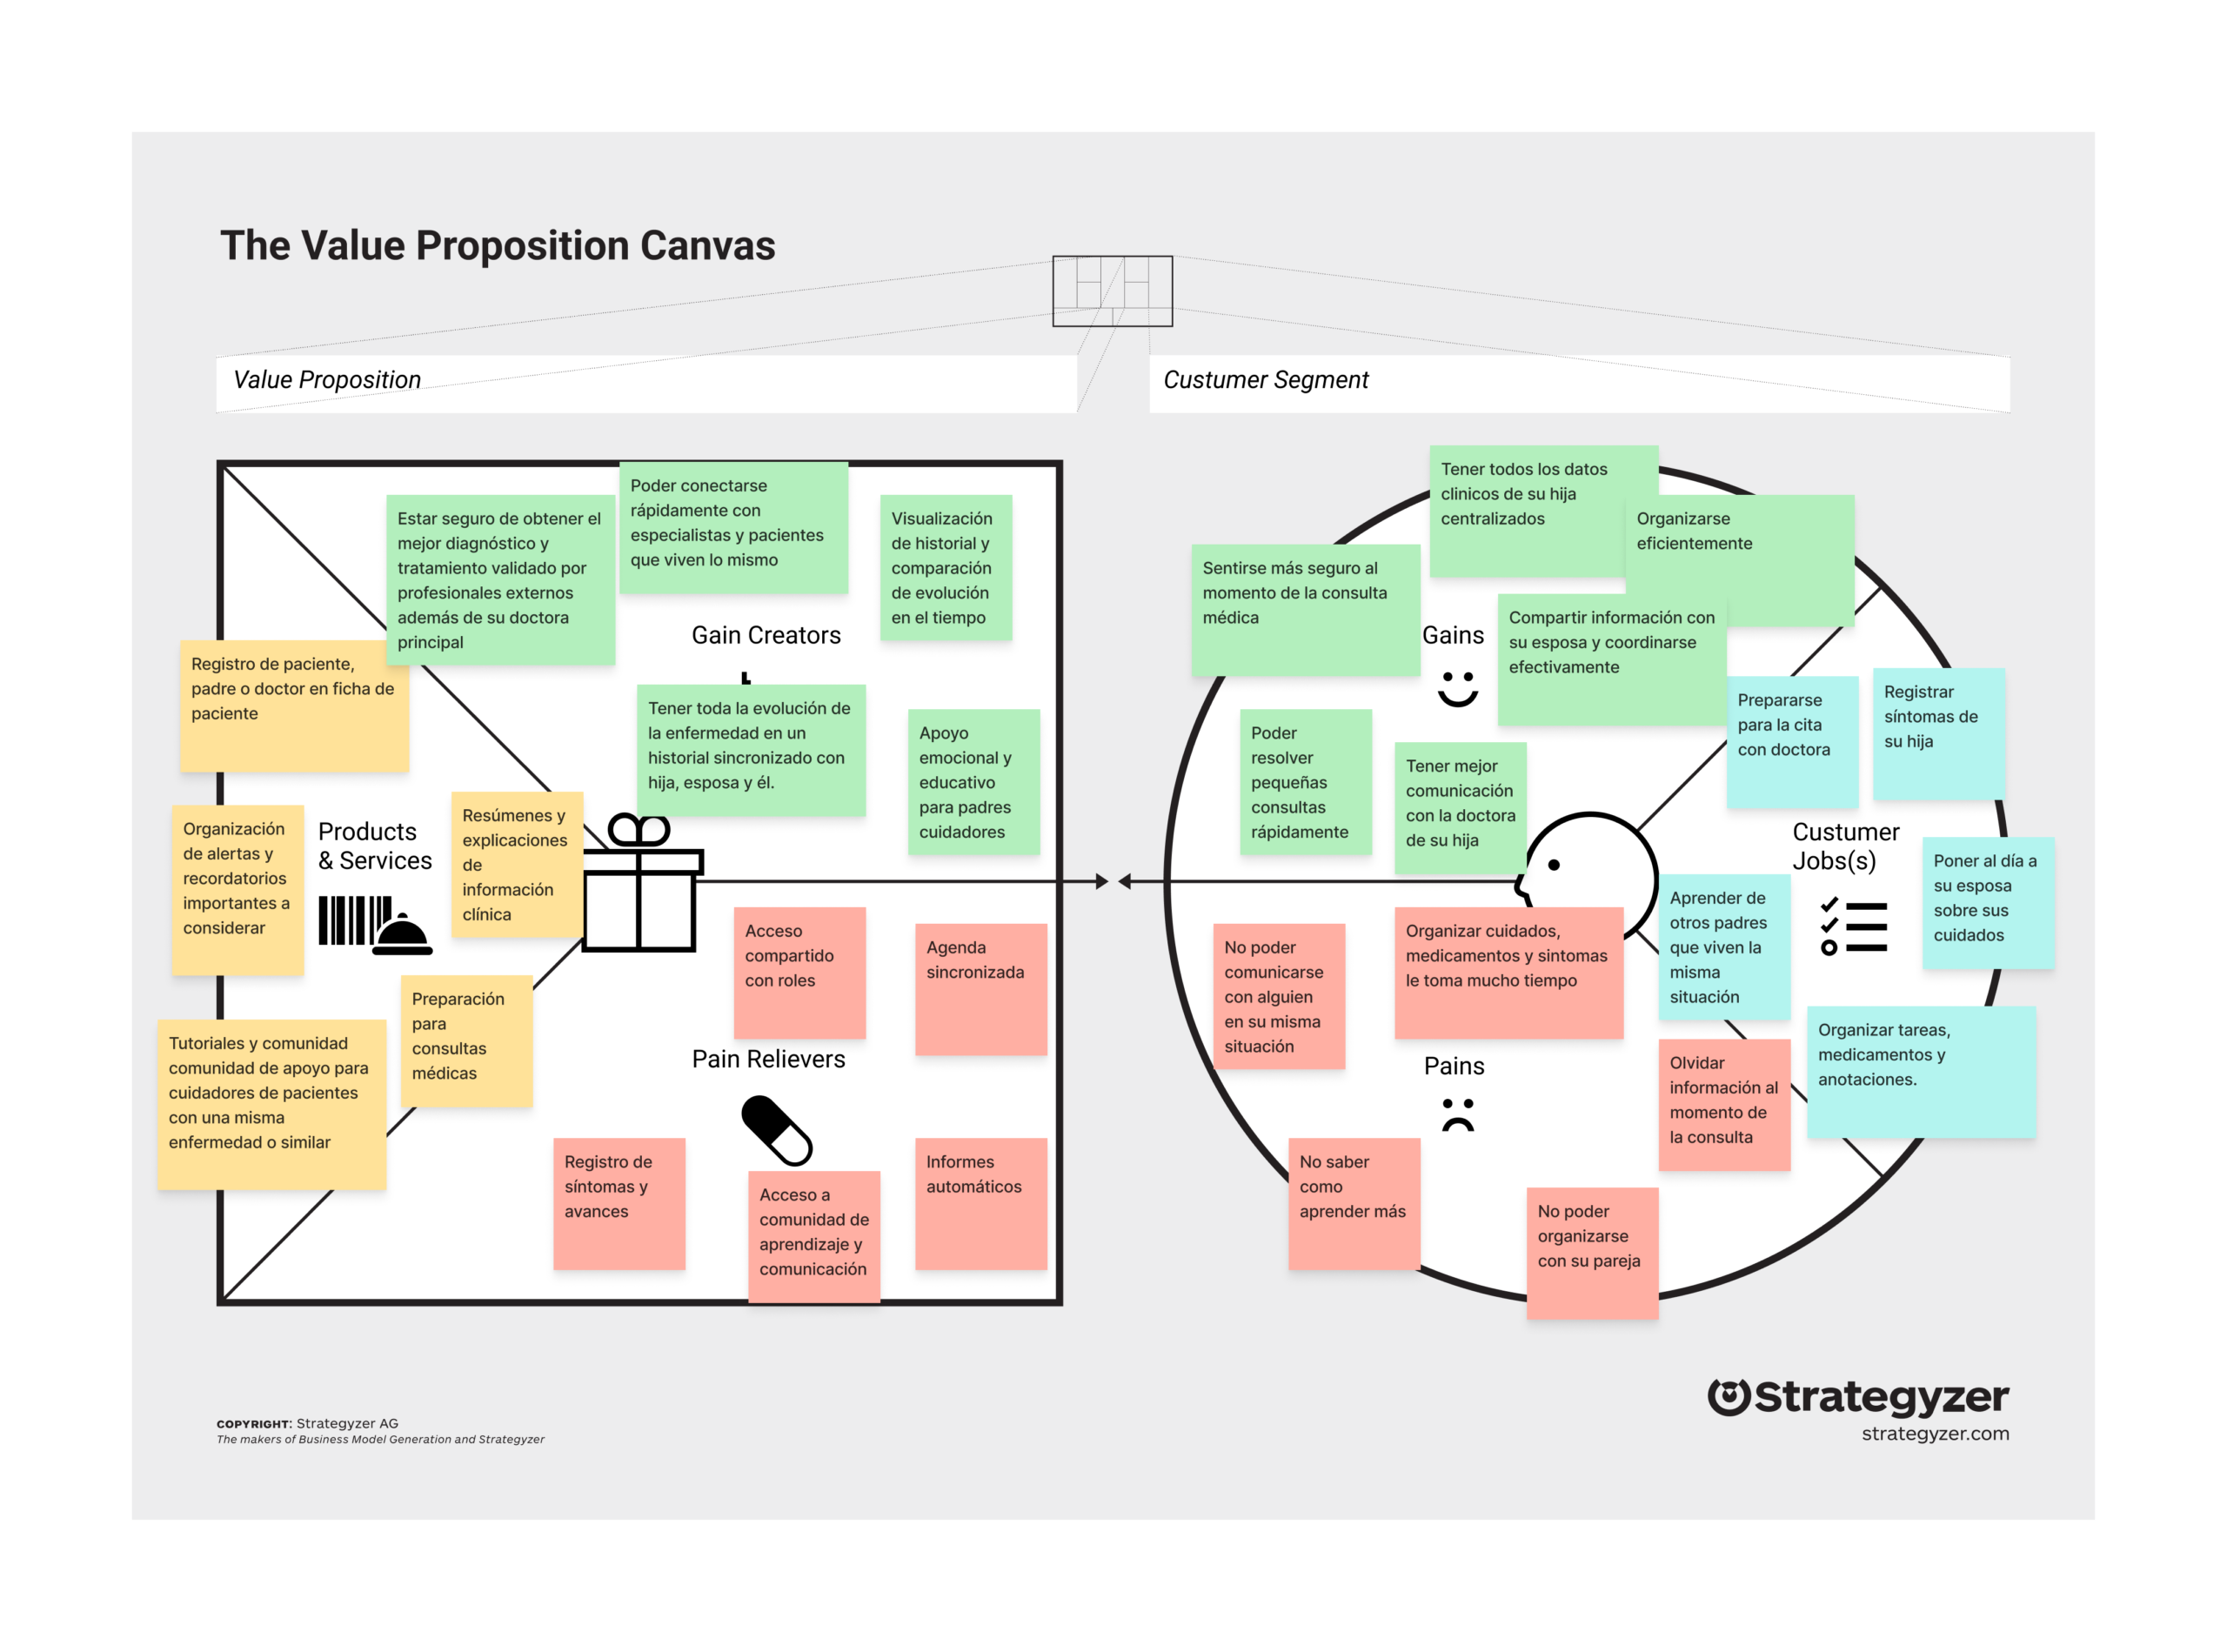
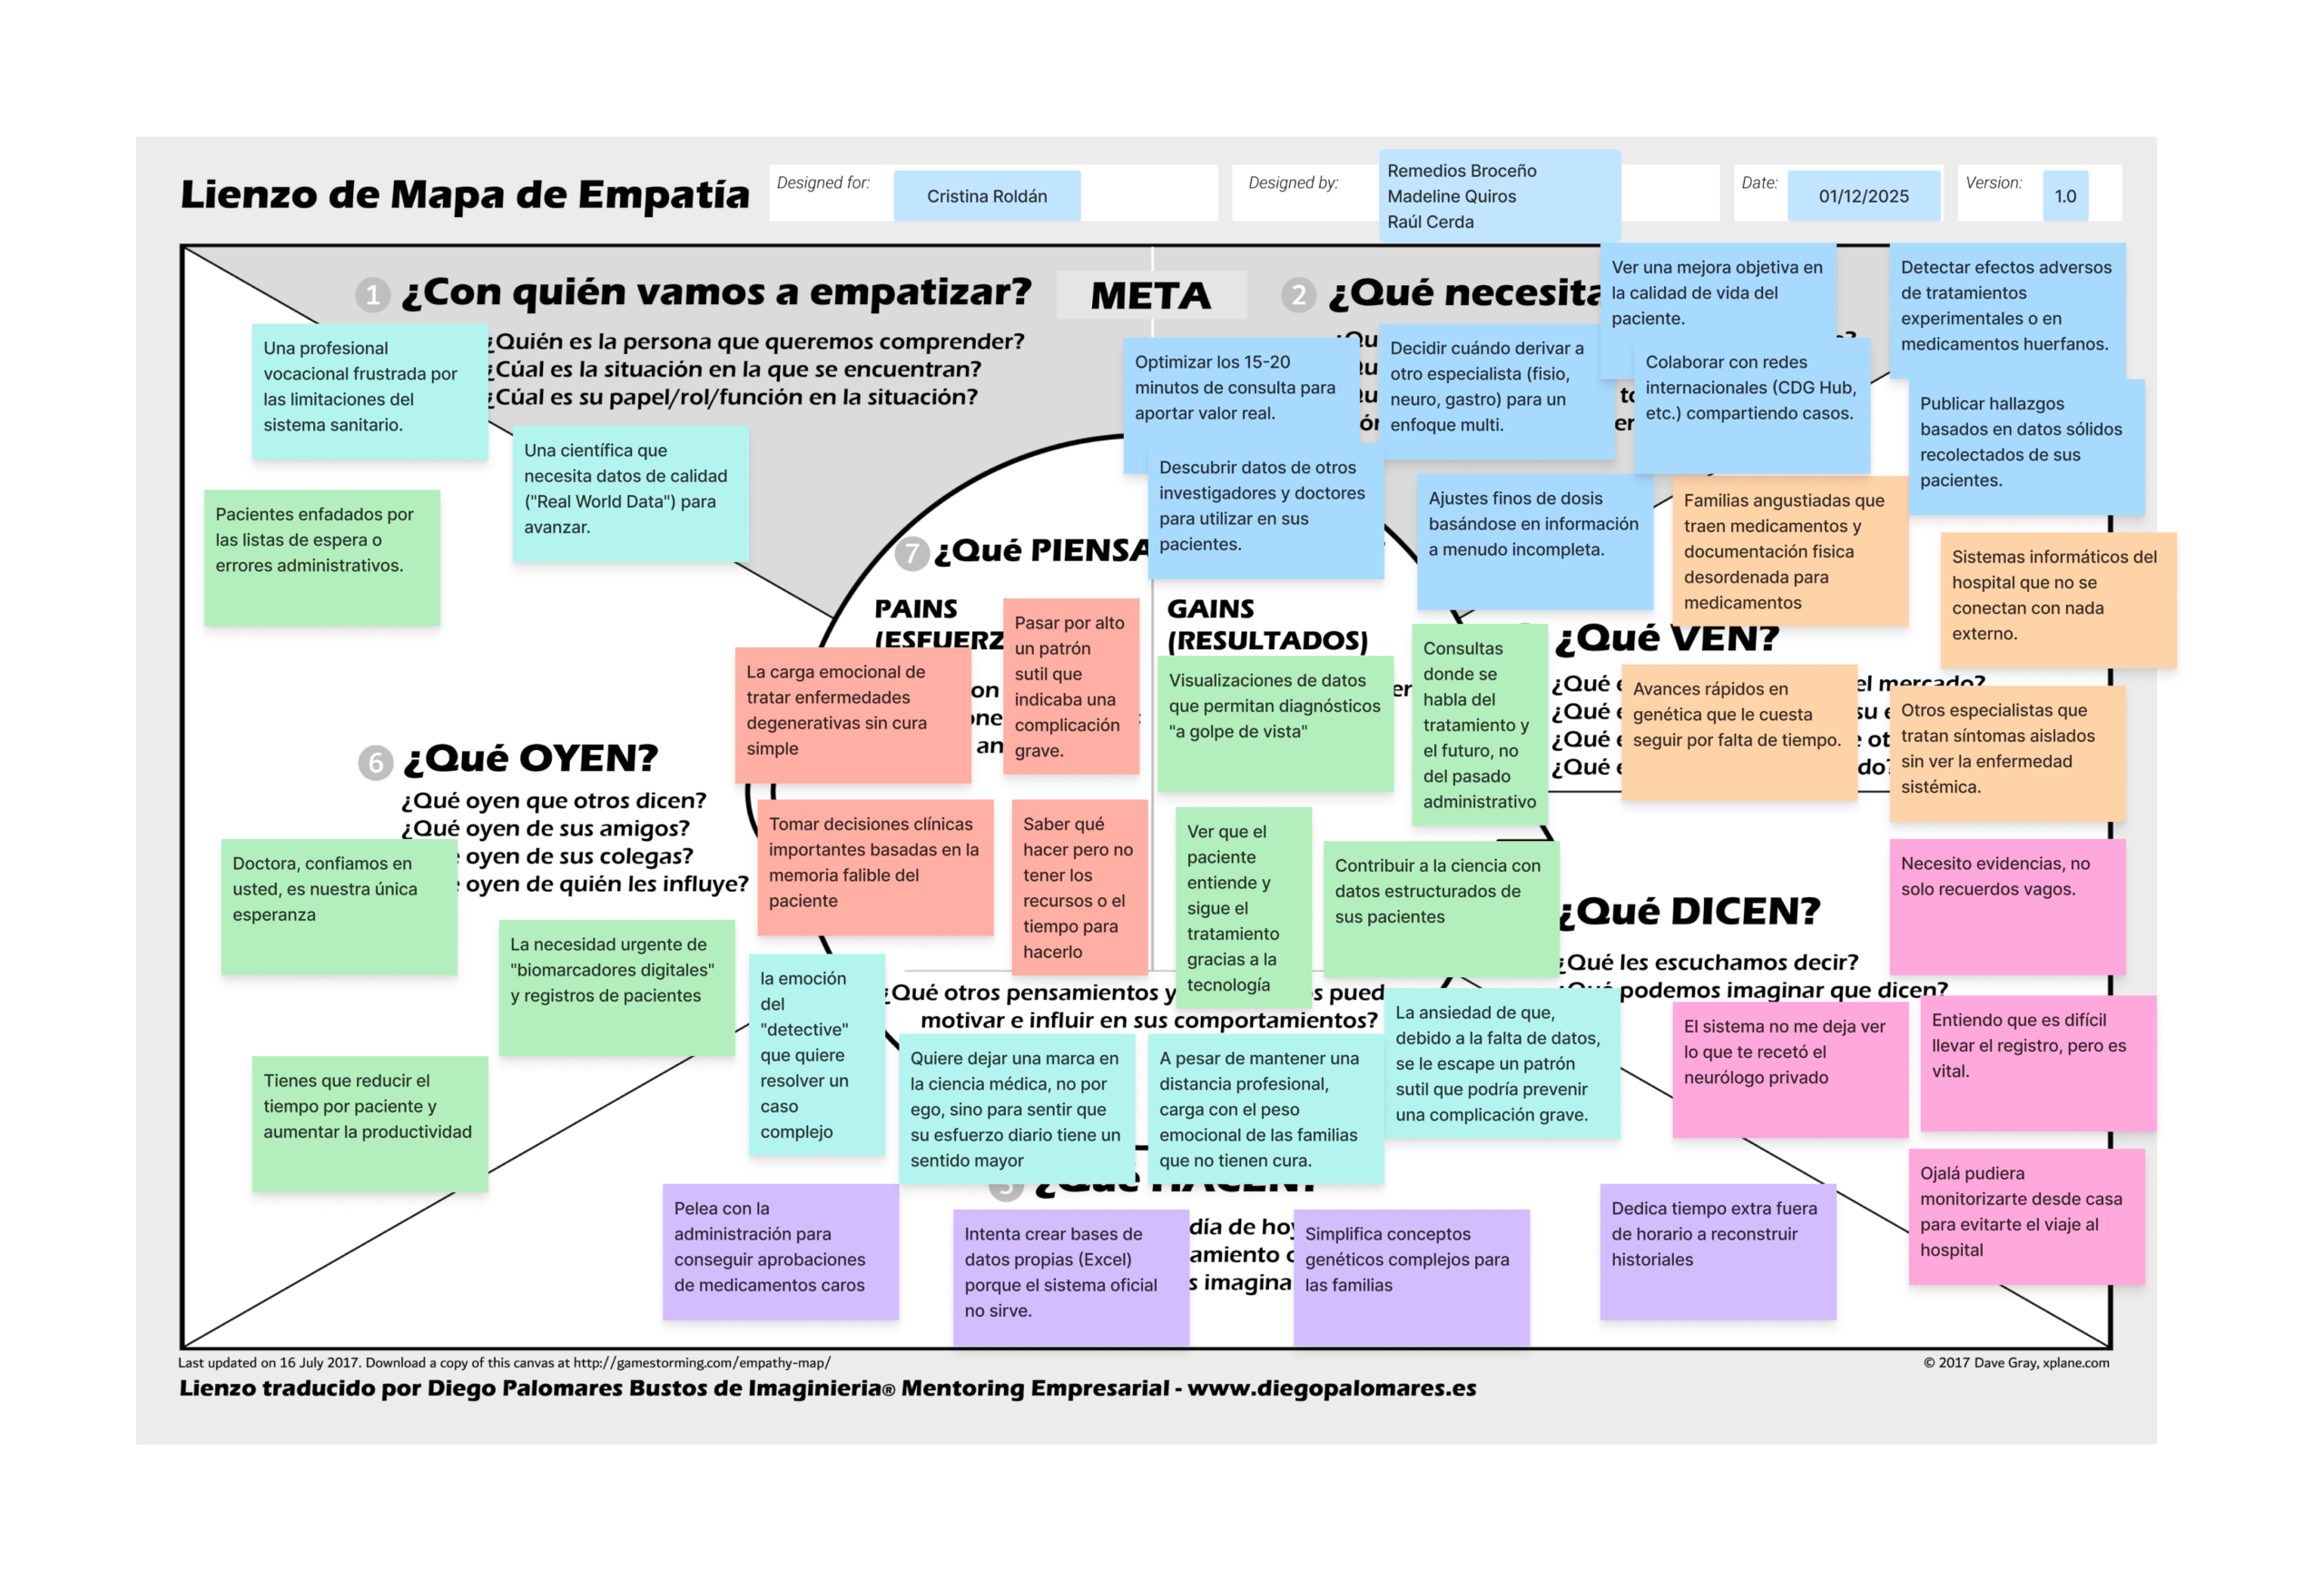
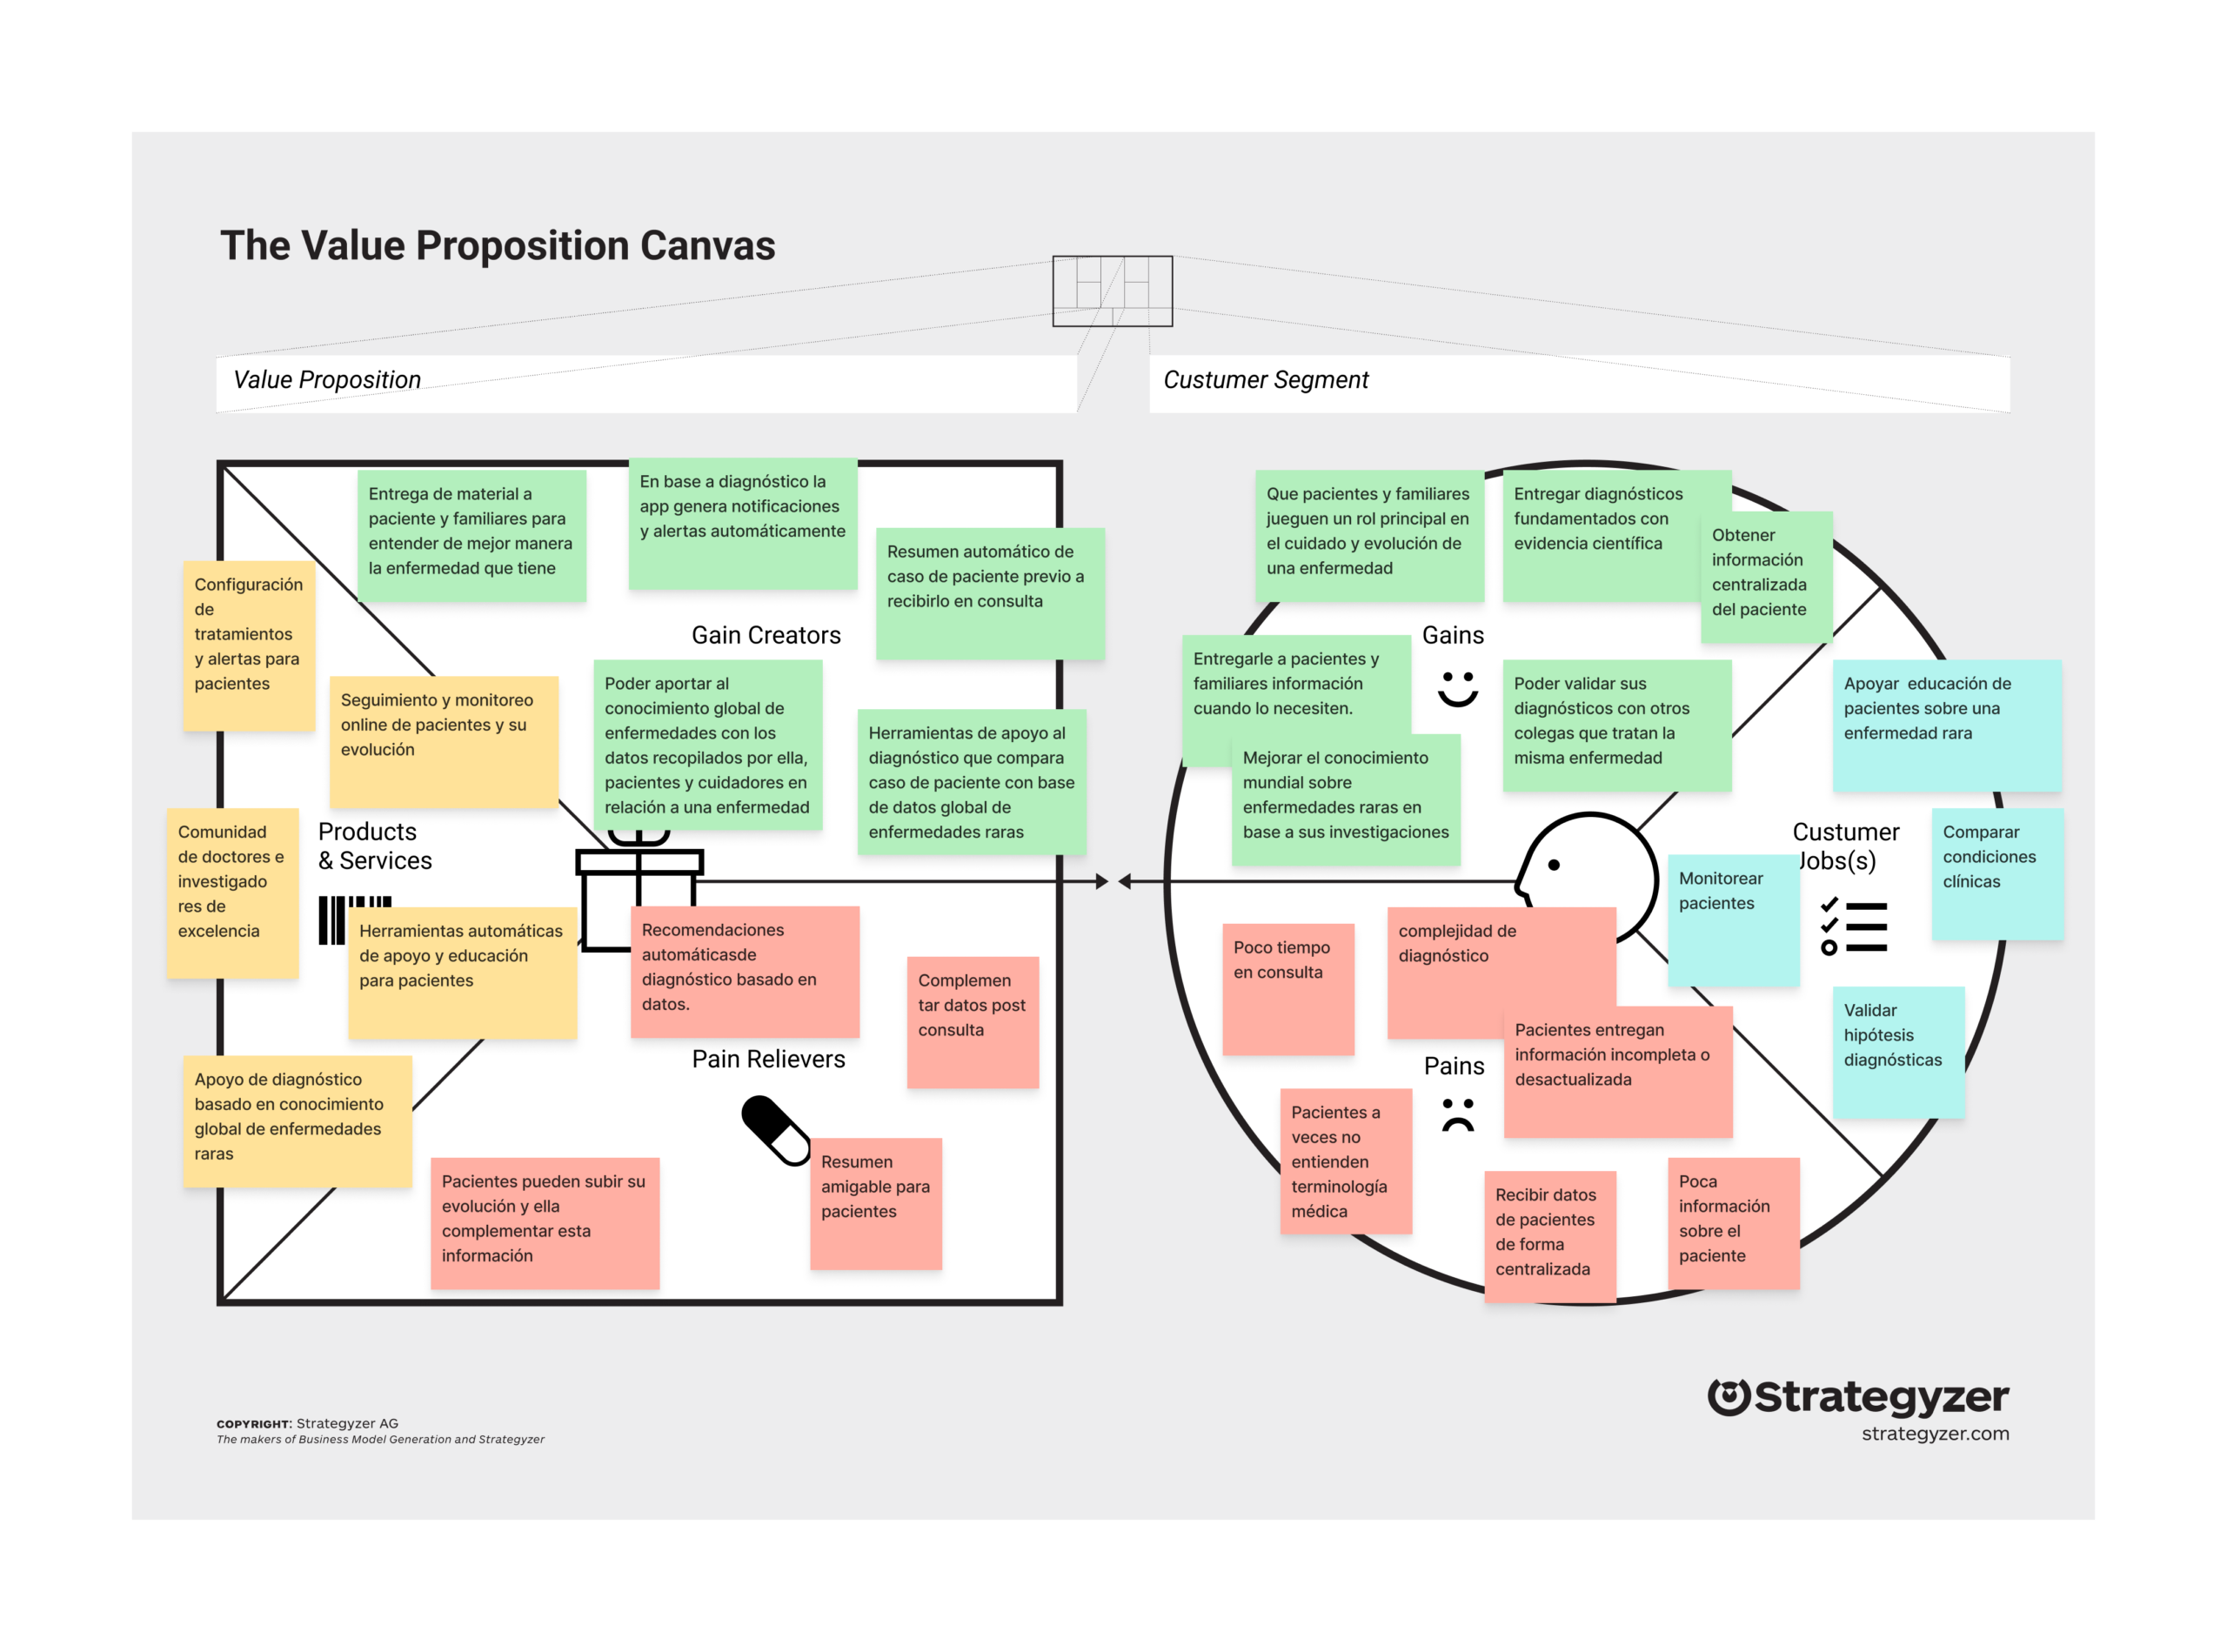
We defined three evidence-based archetypes that humanized the process and gave the team a shared language. For each archetype we built an empathy map and a Value Proposition Canvas, connecting documented jobs, pains, and gains to concrete features.

  • Laura (Patient)
    Seeks autonomy over her medical narrative, validation of symptoms, and reducing the mental load of daily tracking. Her pain point: translating subjective physical sensations into objective data for the doctor.
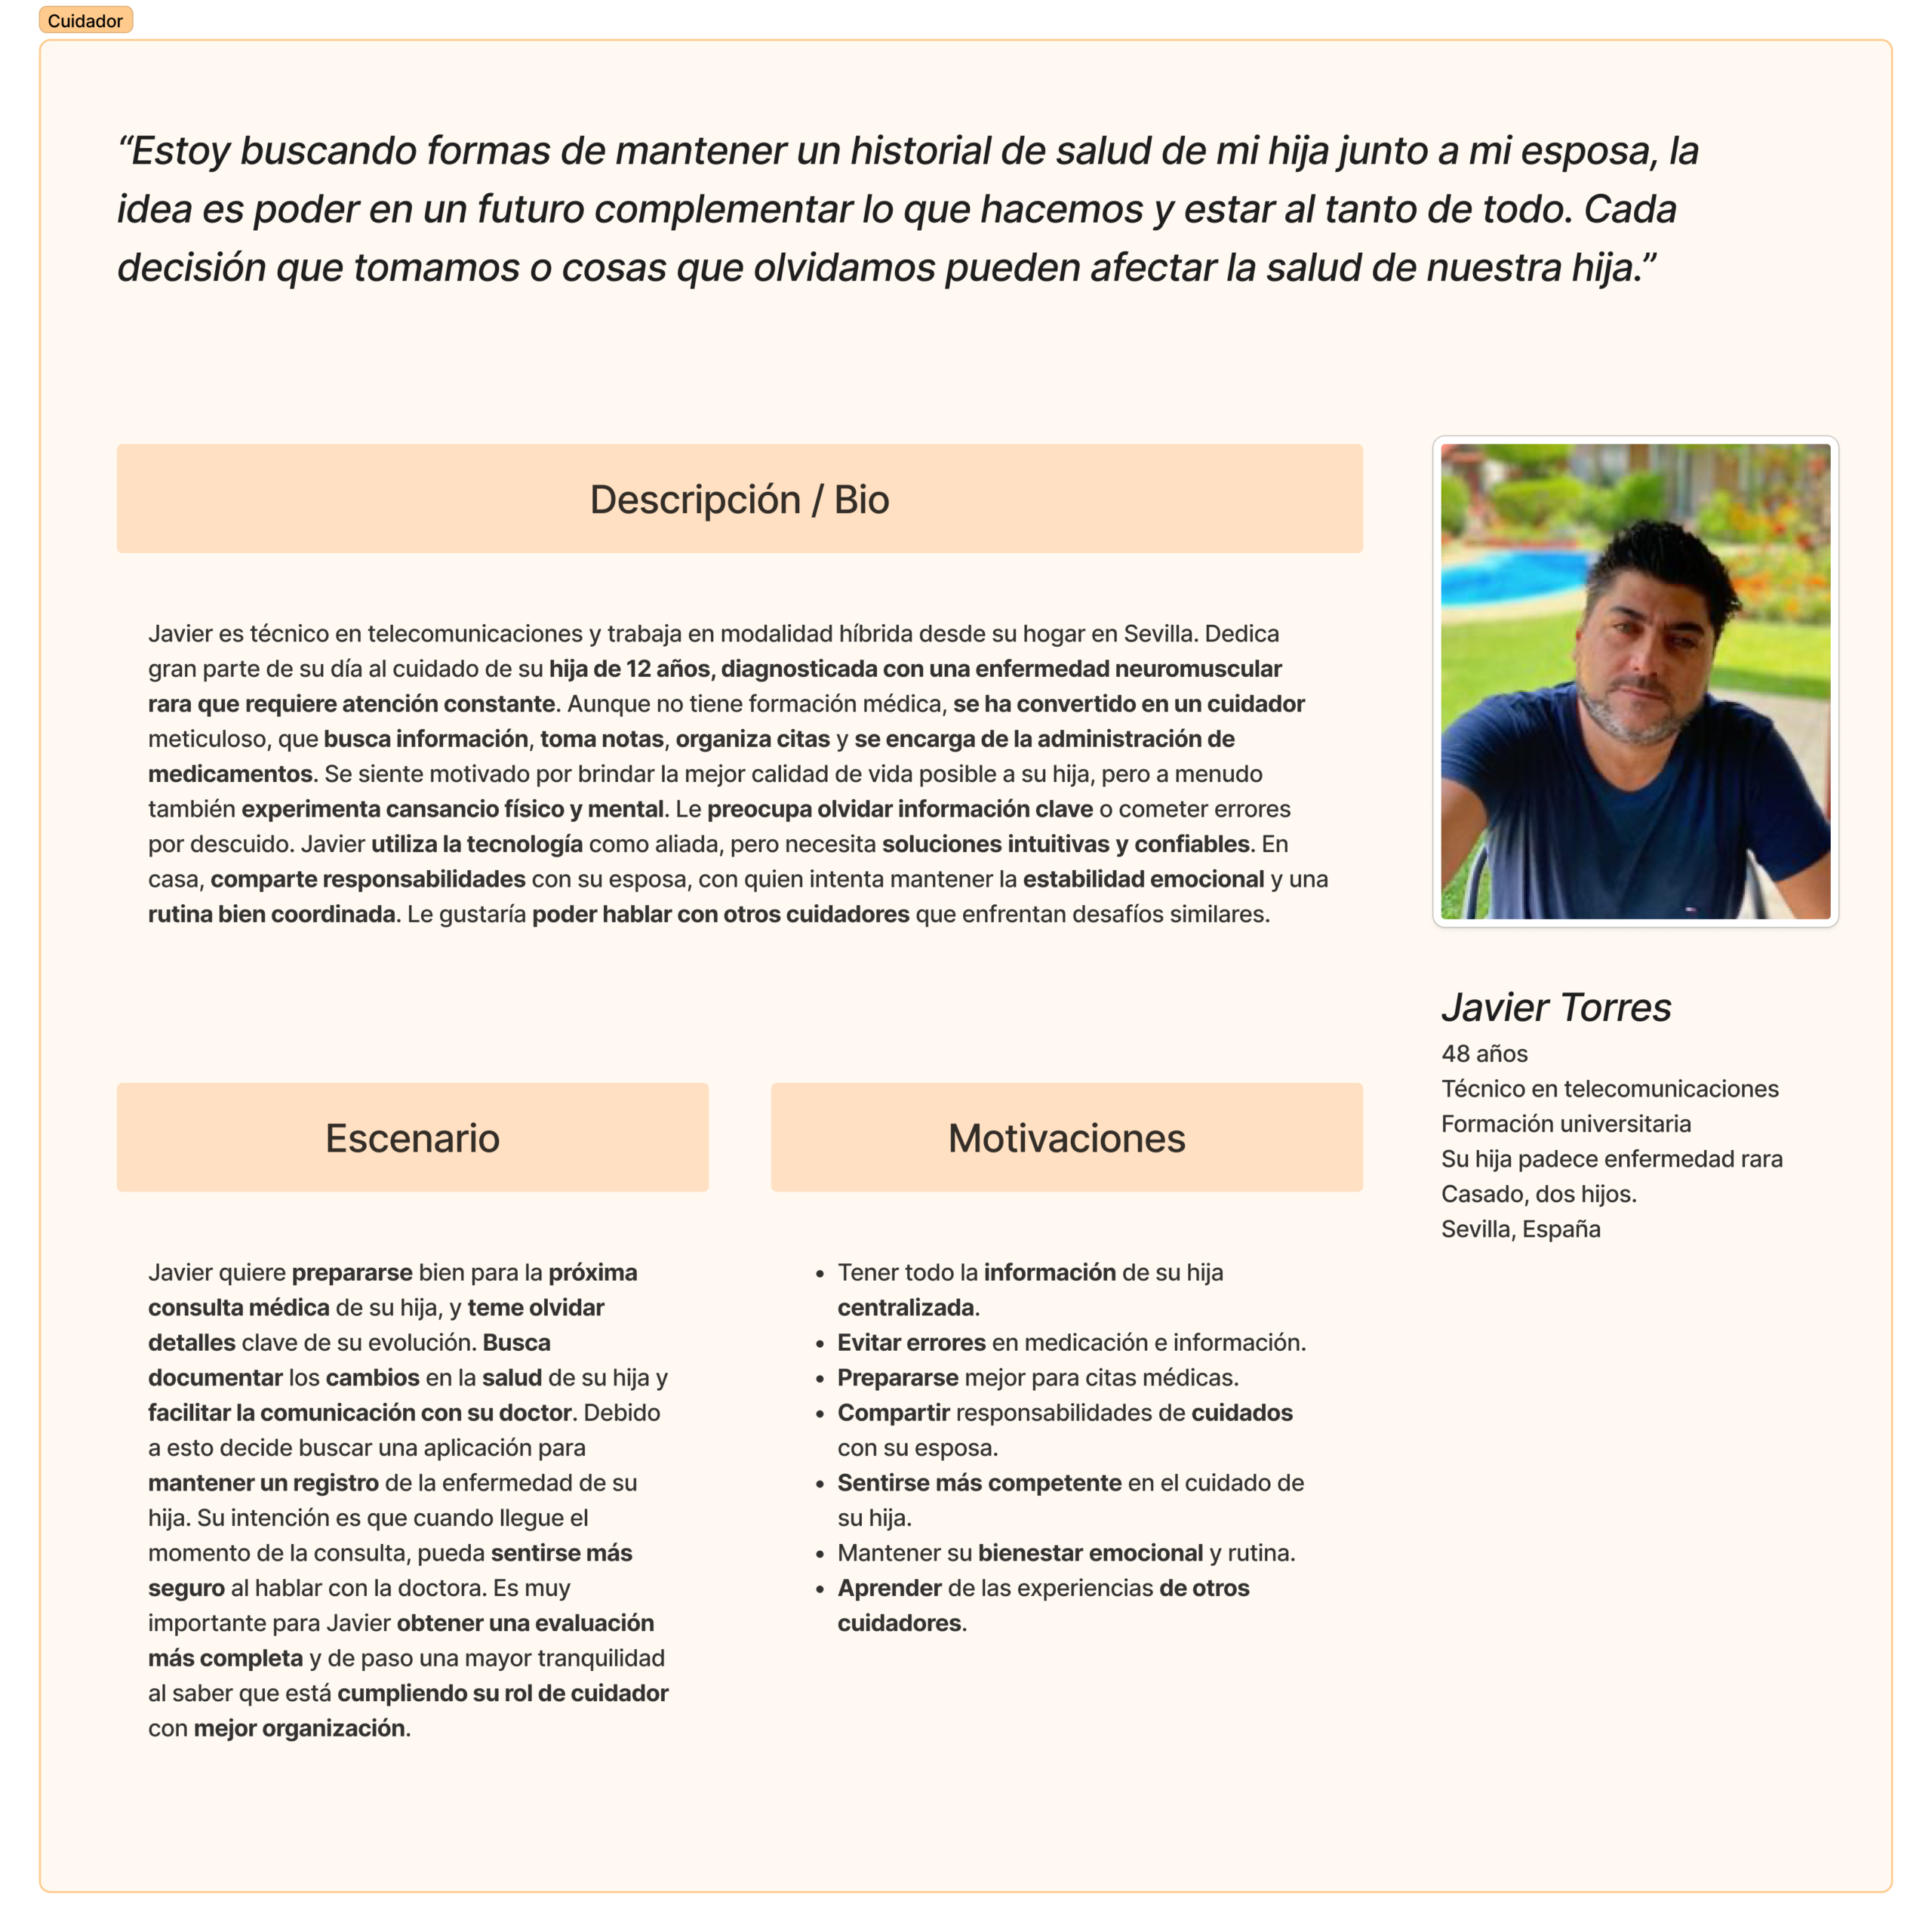
  • Javier (Caregiver/Family member)
    Constant hypervigilance, complex management of medication and appointments, and a feeling of isolation. Needs an operational “copilot” and centralized information.
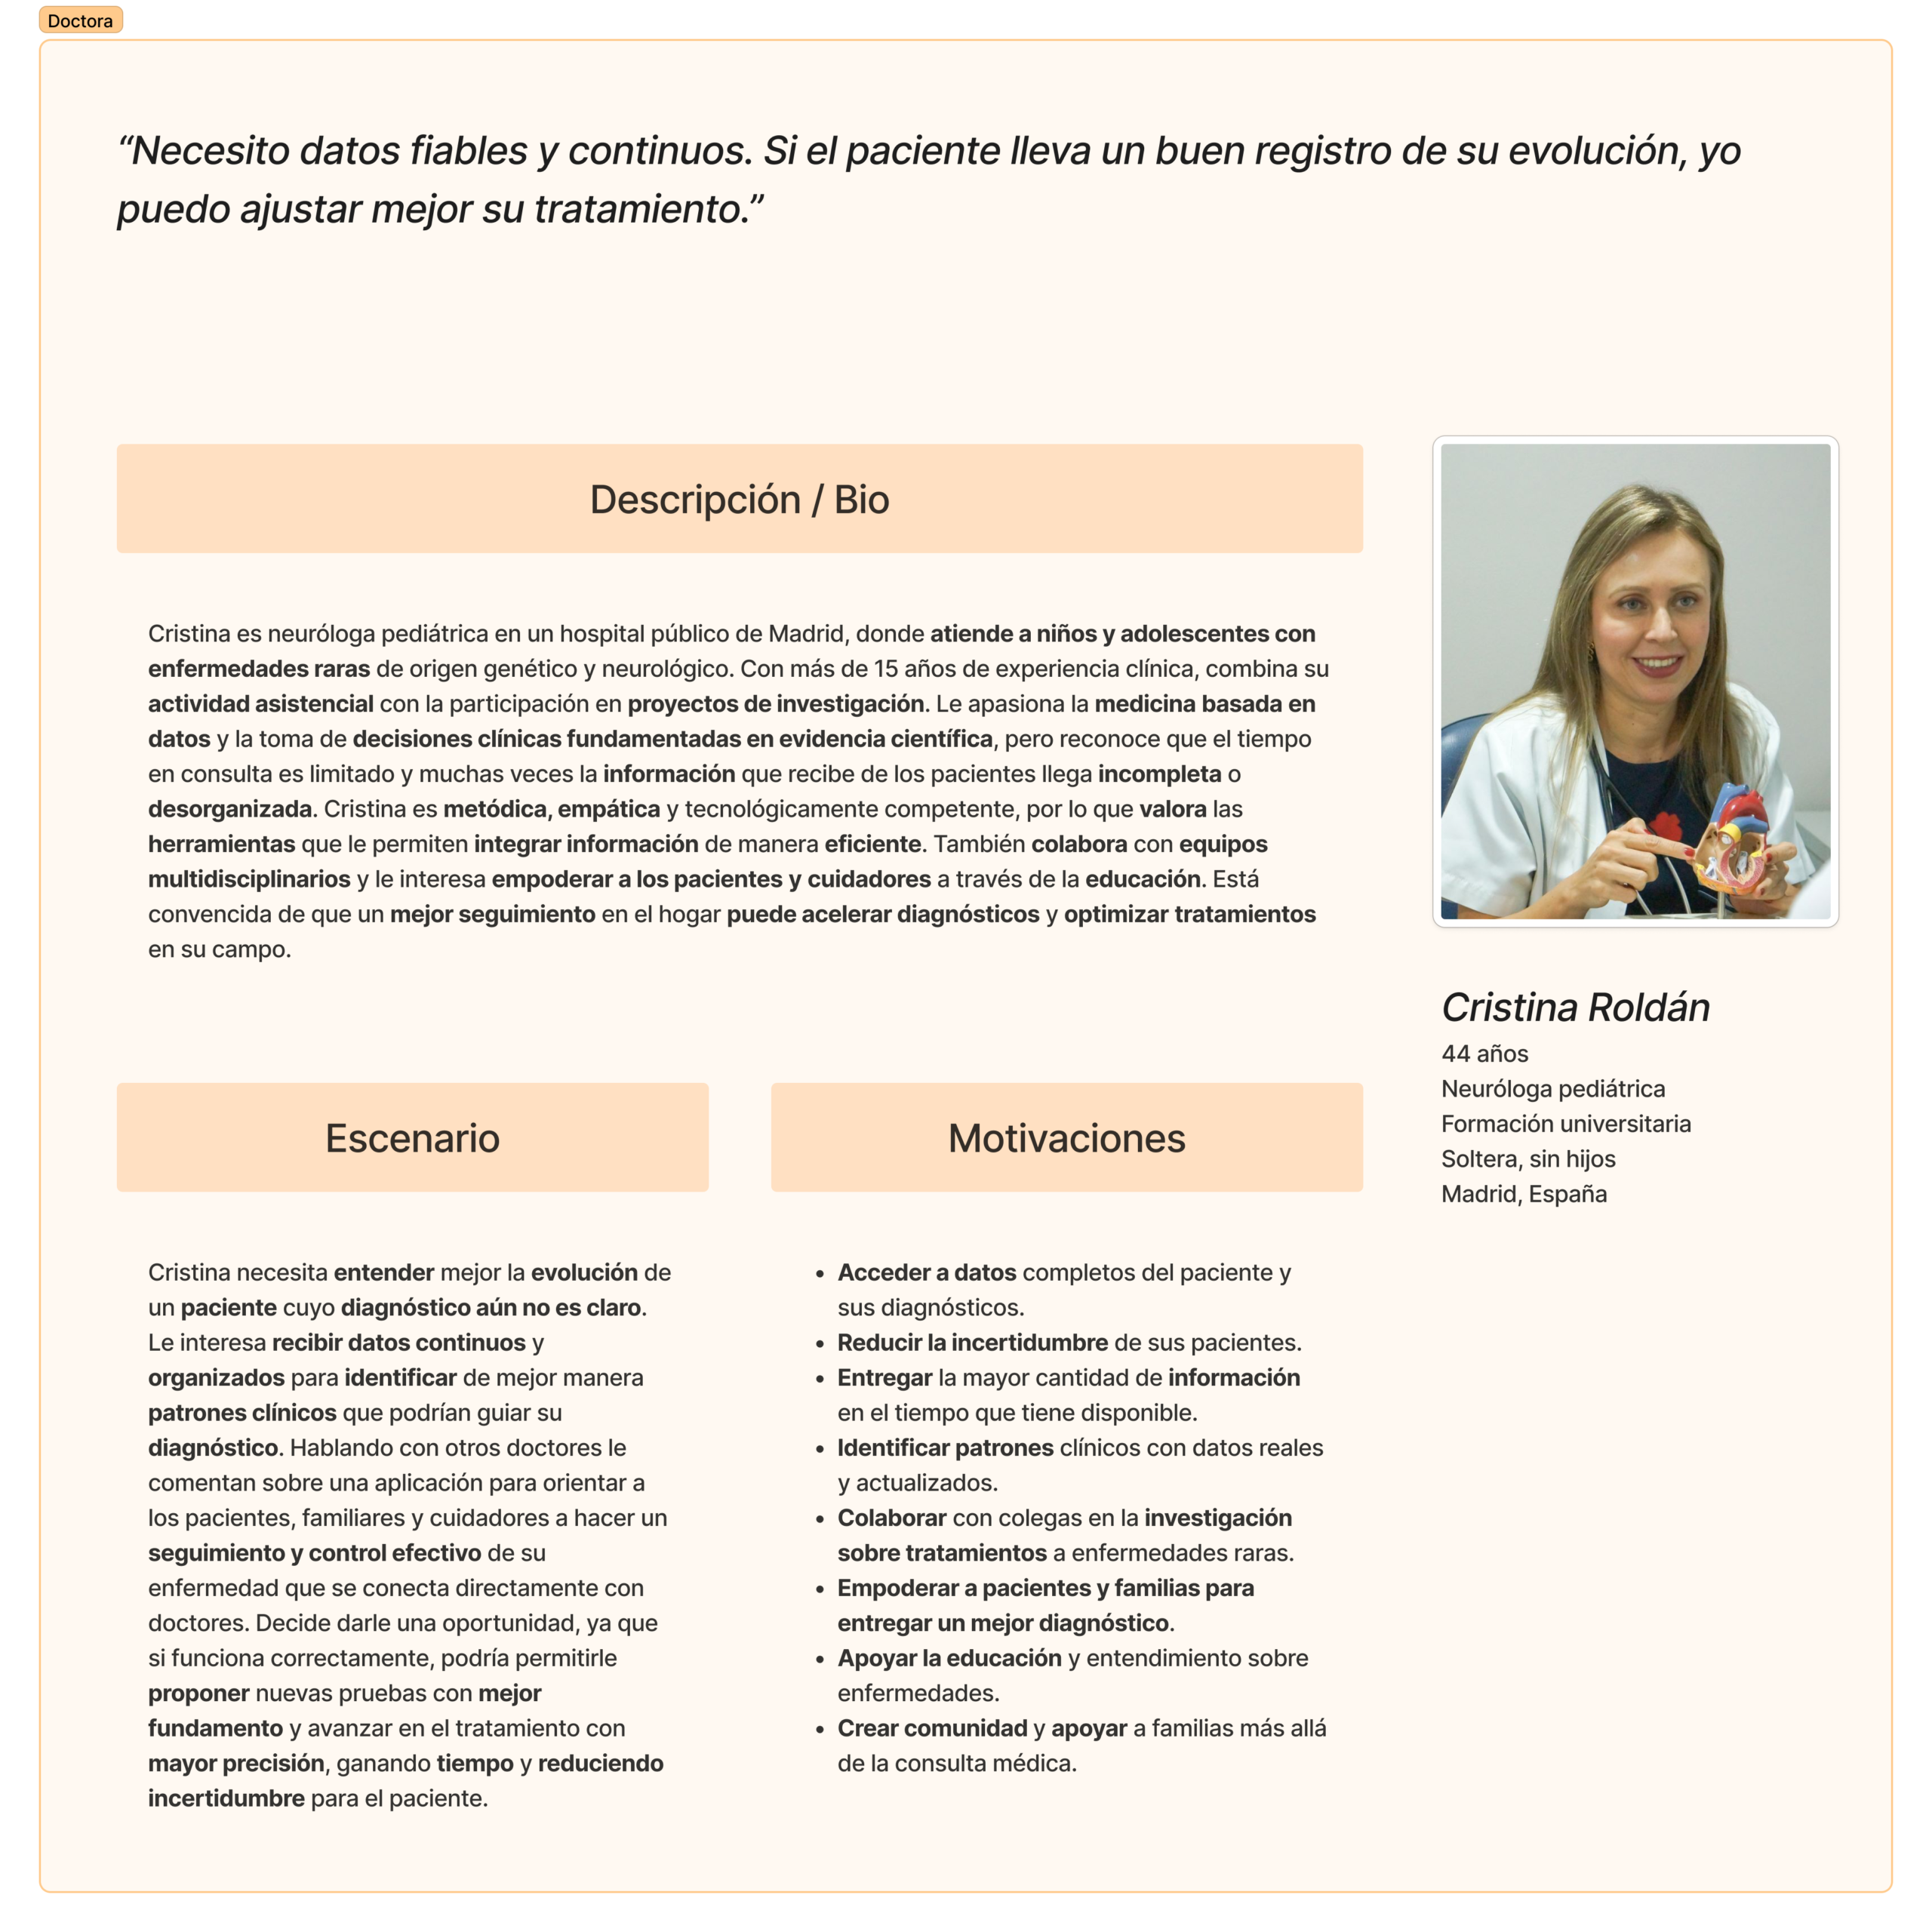
  • Dr. Cristina Roldán (Professional/Researcher)
    Needs reliable, structured data (Real World Data) in the face of fragmented information and patient memory bias.

Patient profiles

Family/caregiver profiles

Doctor/researcher profiles

Patient journey map

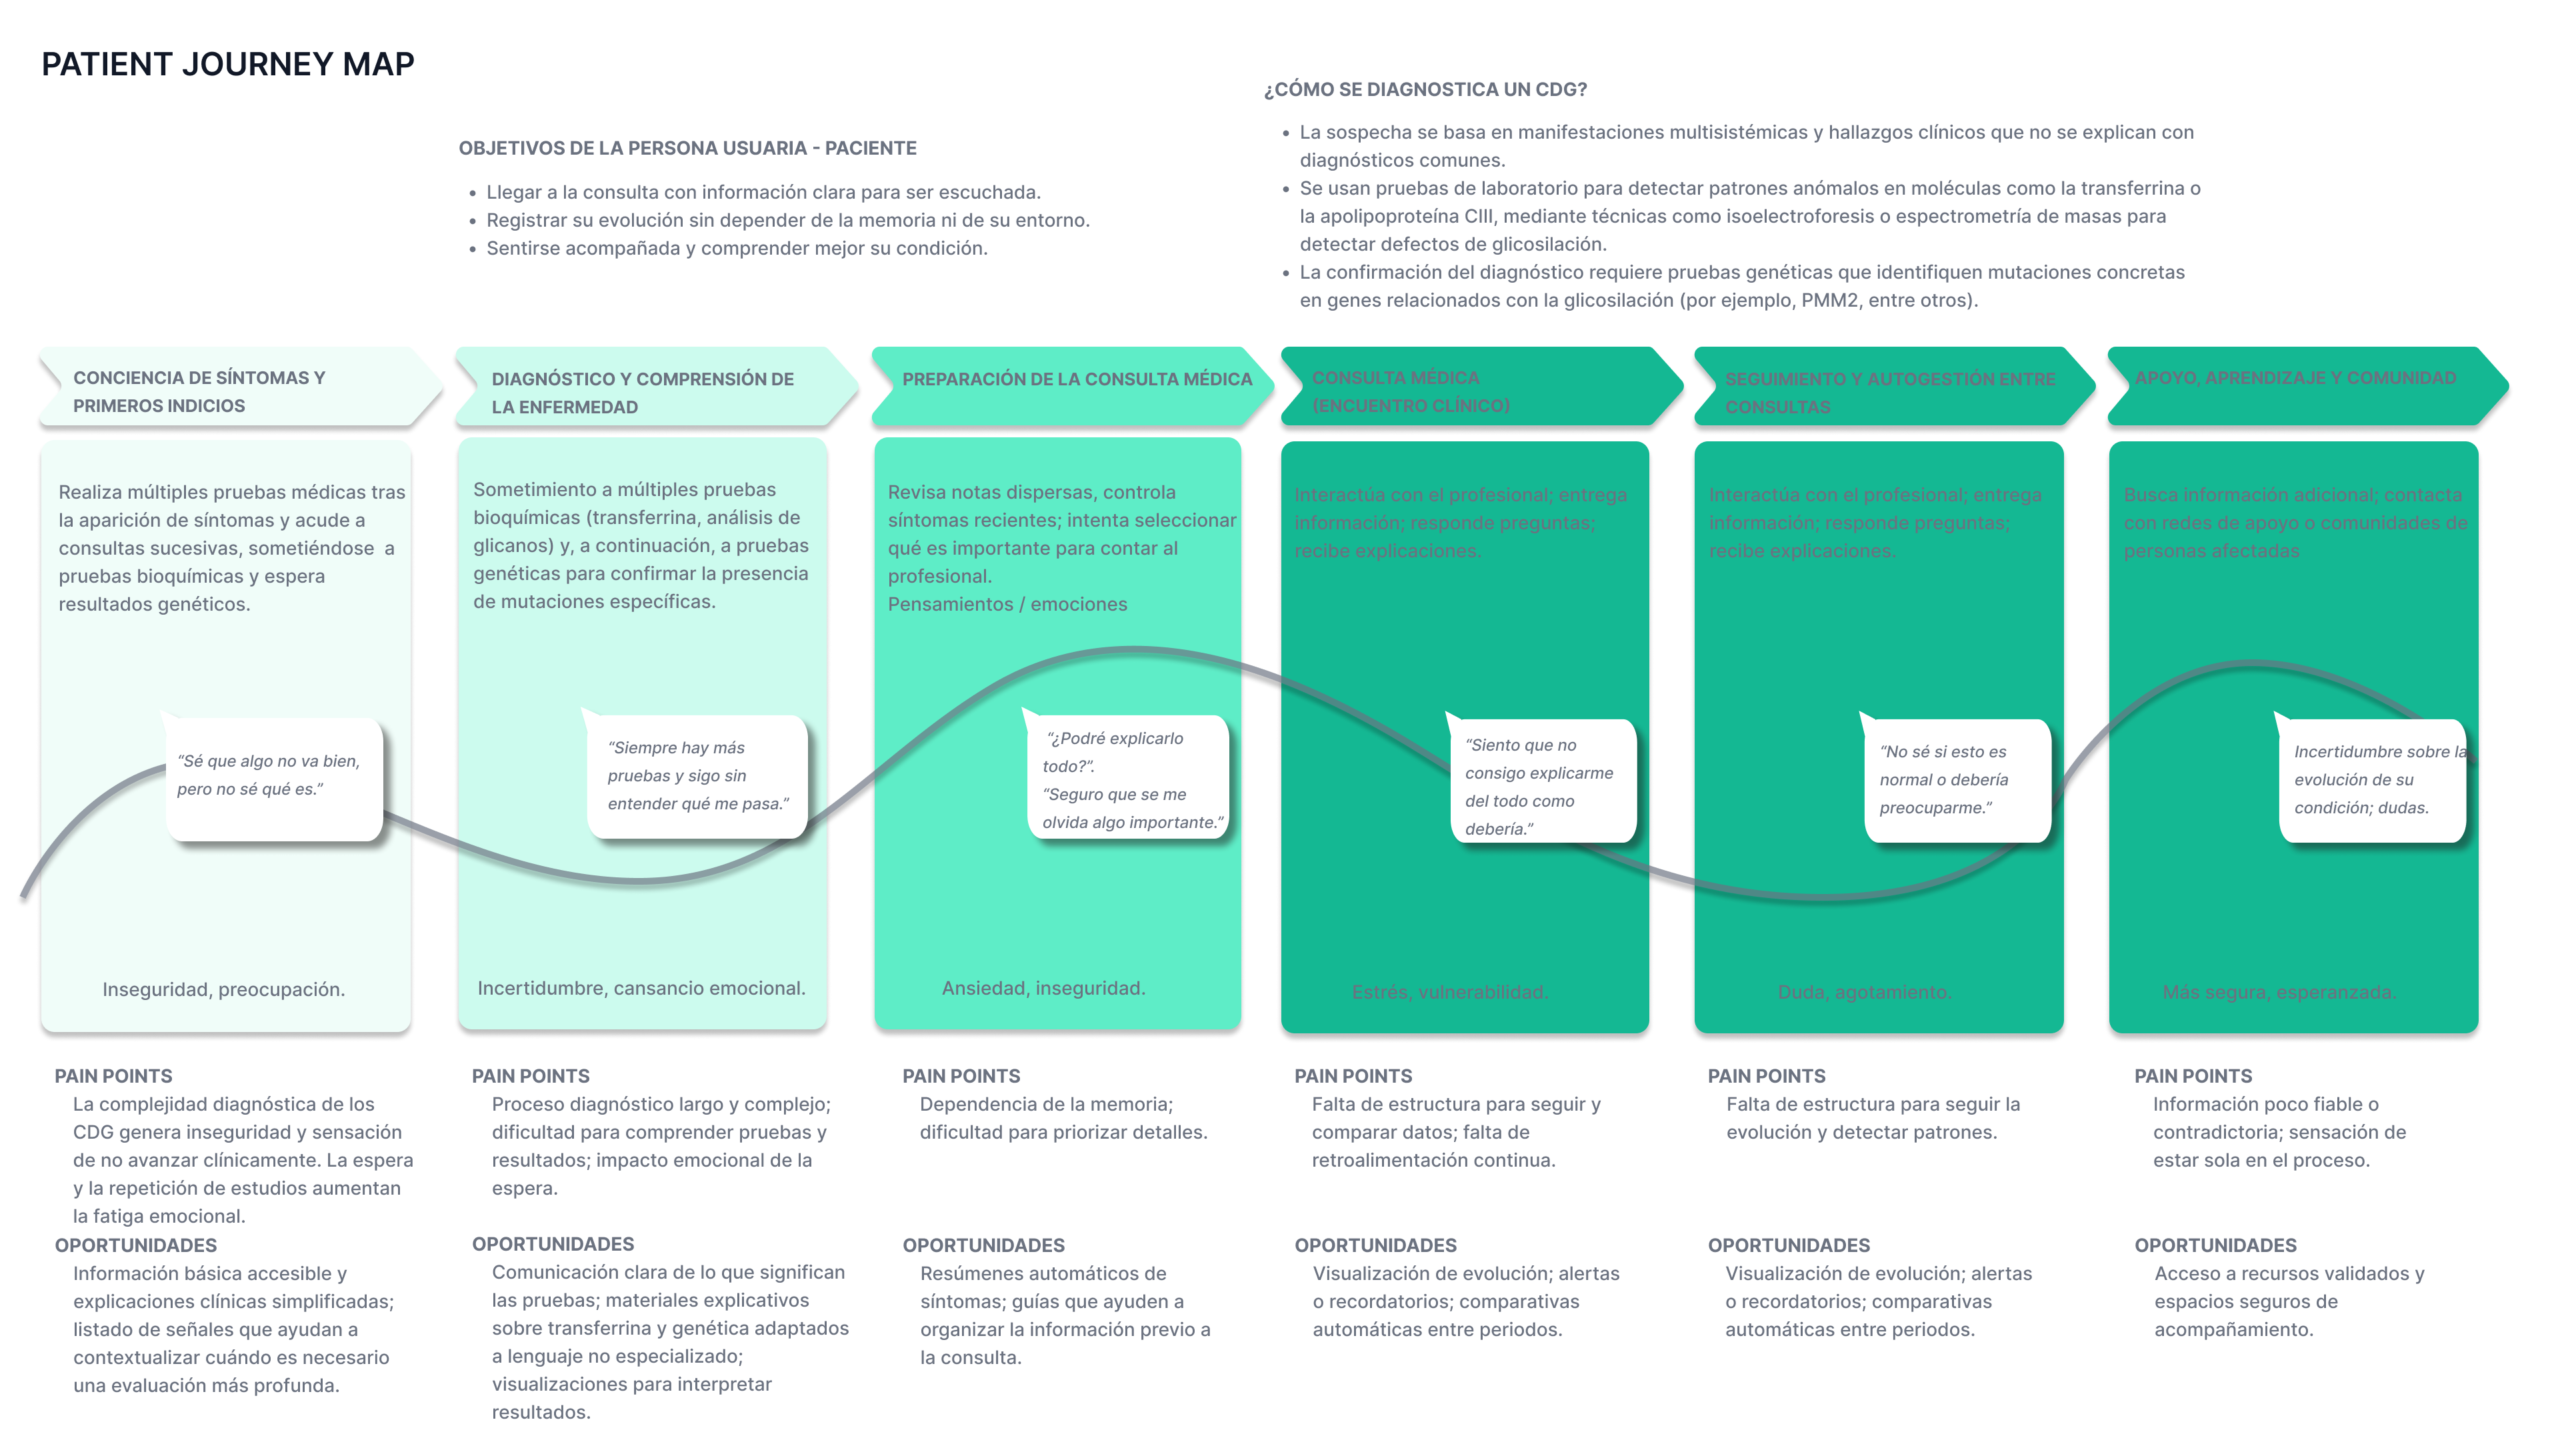
We mapped the patient’s journey across six stages, identifying emotions, pain points, and intervention opportunities at each one:

  • Symptom awareness and first signs
  • Diagnosis and understanding the disease
  • Preparing for the medical appointment
  • The medical appointment
  • Follow-up and self-management between appointments
  • Support, learning, and community

Synthesizing this journey map left us with a product mission that goes beyond logging data — it must be an experience validator, an information hub, and a communication facilitator between every actor in the CDG ecosystem.

Product definition

We organized the insights into four pillars that shaped the product strategy:

  1. Smart, multimodal logging
    • Input via voice, text, and selectors.
    • Wearable integration for passive biomarker collection.
    • Turning scattered qualitative data into visualizable quantitative information.
    • Eliminating memory bias during appointments.
  2. Interoperability and portability
    • Building a shareable, exportable, private “Digital Health Passport.”
    • A quick-access “Emergency Card.”
  3. Health literacy and community
    • A scientifically validated “CDG Wiki.”
    • Support mechanisms between doctors/researchers.
    • Relevant data set apart from what’s found on social media (curated content).
  4. Analytics and research
    • Standardized clinical reports (PDF, HL7 FHIR)
    • Optional donation of anonymized data for research.

PRD

I wrote the Product Requirements Document (v1.0). Its premise was moving from a fragmented health model to a unified digital ecosystem, a single source of truth that supports data-driven decisions and fosters community.

The PRD structured the full solution into four modules (epics):

  1. My Diary (Smart Tracking)
    Goal: multimodal capture and longitudinal tracking of the disease.
    Features: voice/text/selectors, event logging, wearable sync, and data correlation.
  2. Health Passport (Digital Passport)
    Goal: centralizing and making the medical history portable.
    Features: a document repository with OCR, an emergency card (QR), and a clinical timeline.
  3. Support Ecosystem (Community & Care)
    Goal: reducing isolation and improving health literacy.
    Features: CDG Wiki, topic-based forums, and a mentorship program.
  4. Management and Analysis (Insights & Export)
    Goal: turning data into value for clinical decisions and research.
    Features: clinical reports, an evolution dashboard, and data donation (opt-in).


We defined the non-functional requirements critical in a health context: WCAG 2.1 AA, E2EE encryption and GDPR/HIPAA compliance, offline availability (local-first) for critical functions, efficiency/low cognitive load, and technical scalability.

Prioritized MVP

With everything mapped out and a complete vision in hand (44 features), we moved to an 18-feature MVP across 5 modules, prioritized with MoSCoW (Must have, Should have, Could have, and Won’t have), built around three goals that concentrate ~80% of the immediate value:

  1. Logging daily health simply.
  2. Reviewing progress through clear visualizations.
  3. Preparing for medical appointments while reducing administrative load.
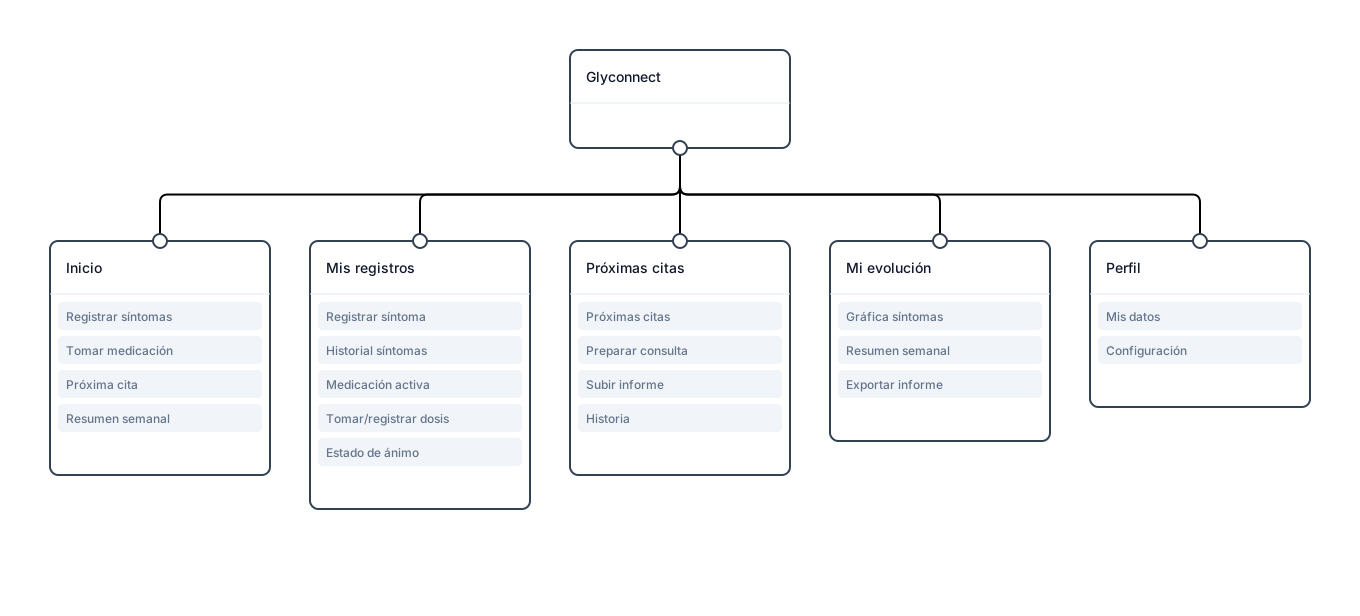
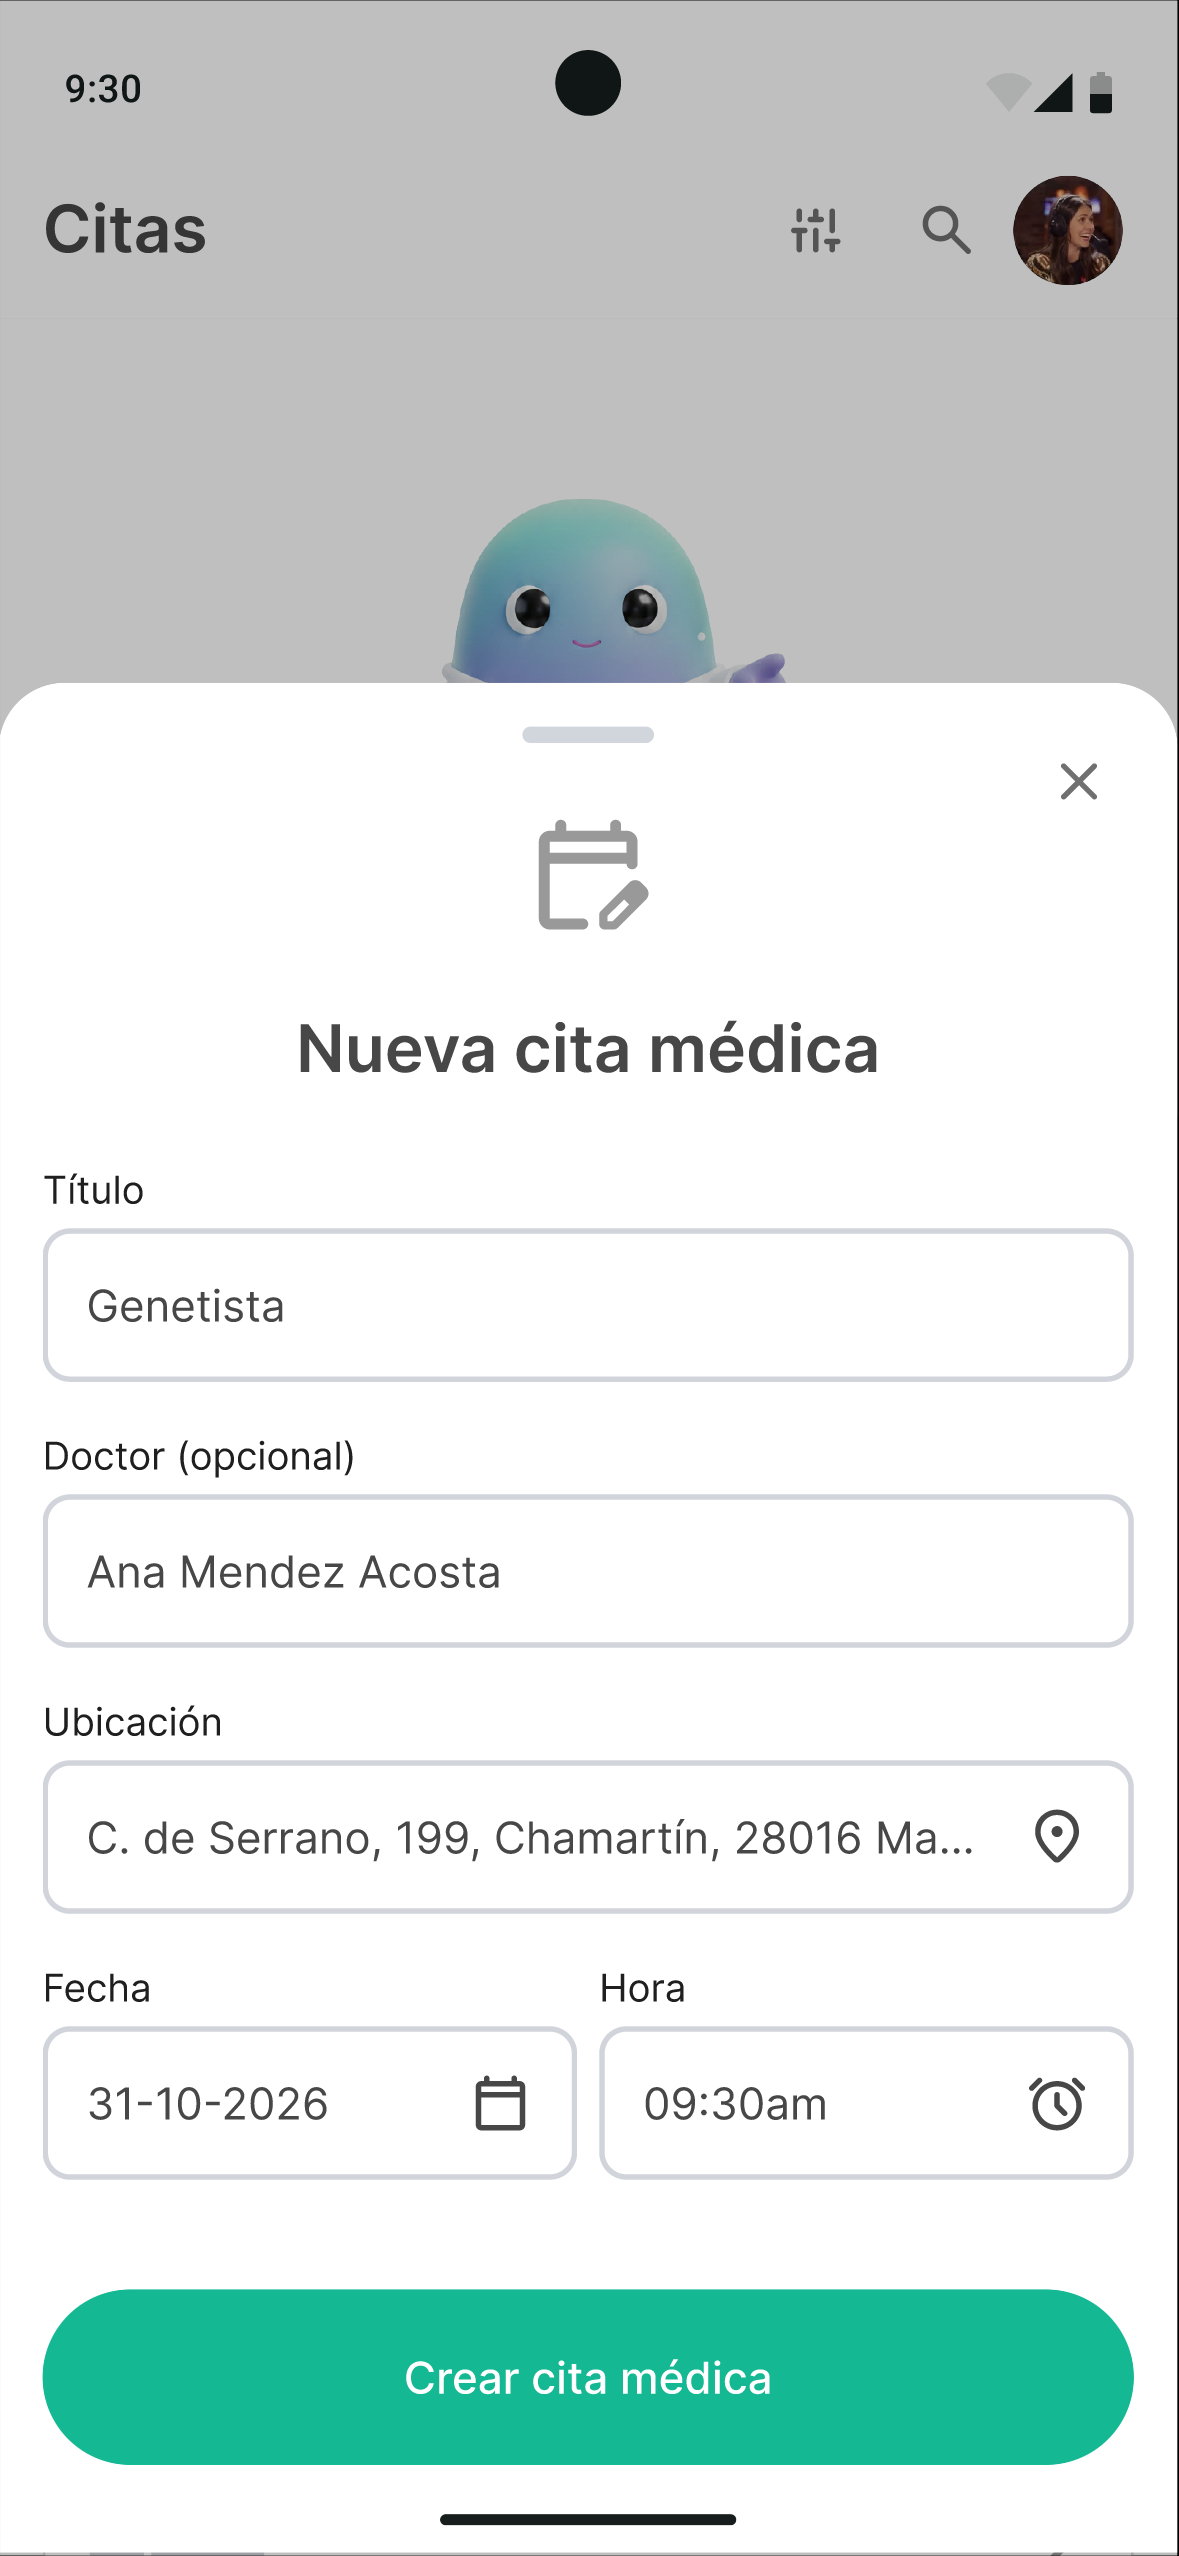
  • Home (Dashboard and quick access)
    • Log a symptom
    • Take medication
    • Next appointment
    • Weekly summary
  • My records (Symptoms, medication, and status)
    • Log a symptom
    • View symptom history
    • Active medication
    • Take/log a dose
    • Mood
  • Appointments (Medical visits)
    • Upcoming appointments
    • Prepare for the appointment
    • Upload a report
    • History
  • My progress (Trends and analysis)
    • Symptom charts
    • Weekly summary
    • Export report
  • Profile
    • My information
    • Settings

We left community, mentorship, and advanced wearable integration out of the MVP (Won’t have, for now), precisely to validate the foundation first and be able to iterate without restructuring the architecture.

The focus group, later on, would flip this priority on its head — a lesson on the gap between what product logic suggests and what the community actually needs.

Information architecture and card sorting

We designed a preliminary architecture based on the empathy maps and the journey, minimizing navigation depth around Home/Dashboard, Log, Calendar, Progress, Resources/Community, Emergencies and SOS, and Profile. Since card sorting with real users wasn’t possible at that stage, I ran a theoretical card sort based on archetypes and insights, prioritizing clear language and avoiding medical jargon.

Design system and UI

The design system was built as a team, with my contributions in components and the UI kit. It was grounded in three principles: Empathy (compassionate design), Accessibility (WCAG 2.1 AA), and Clarity (simple, direct information for moments of stress).

Brand identity
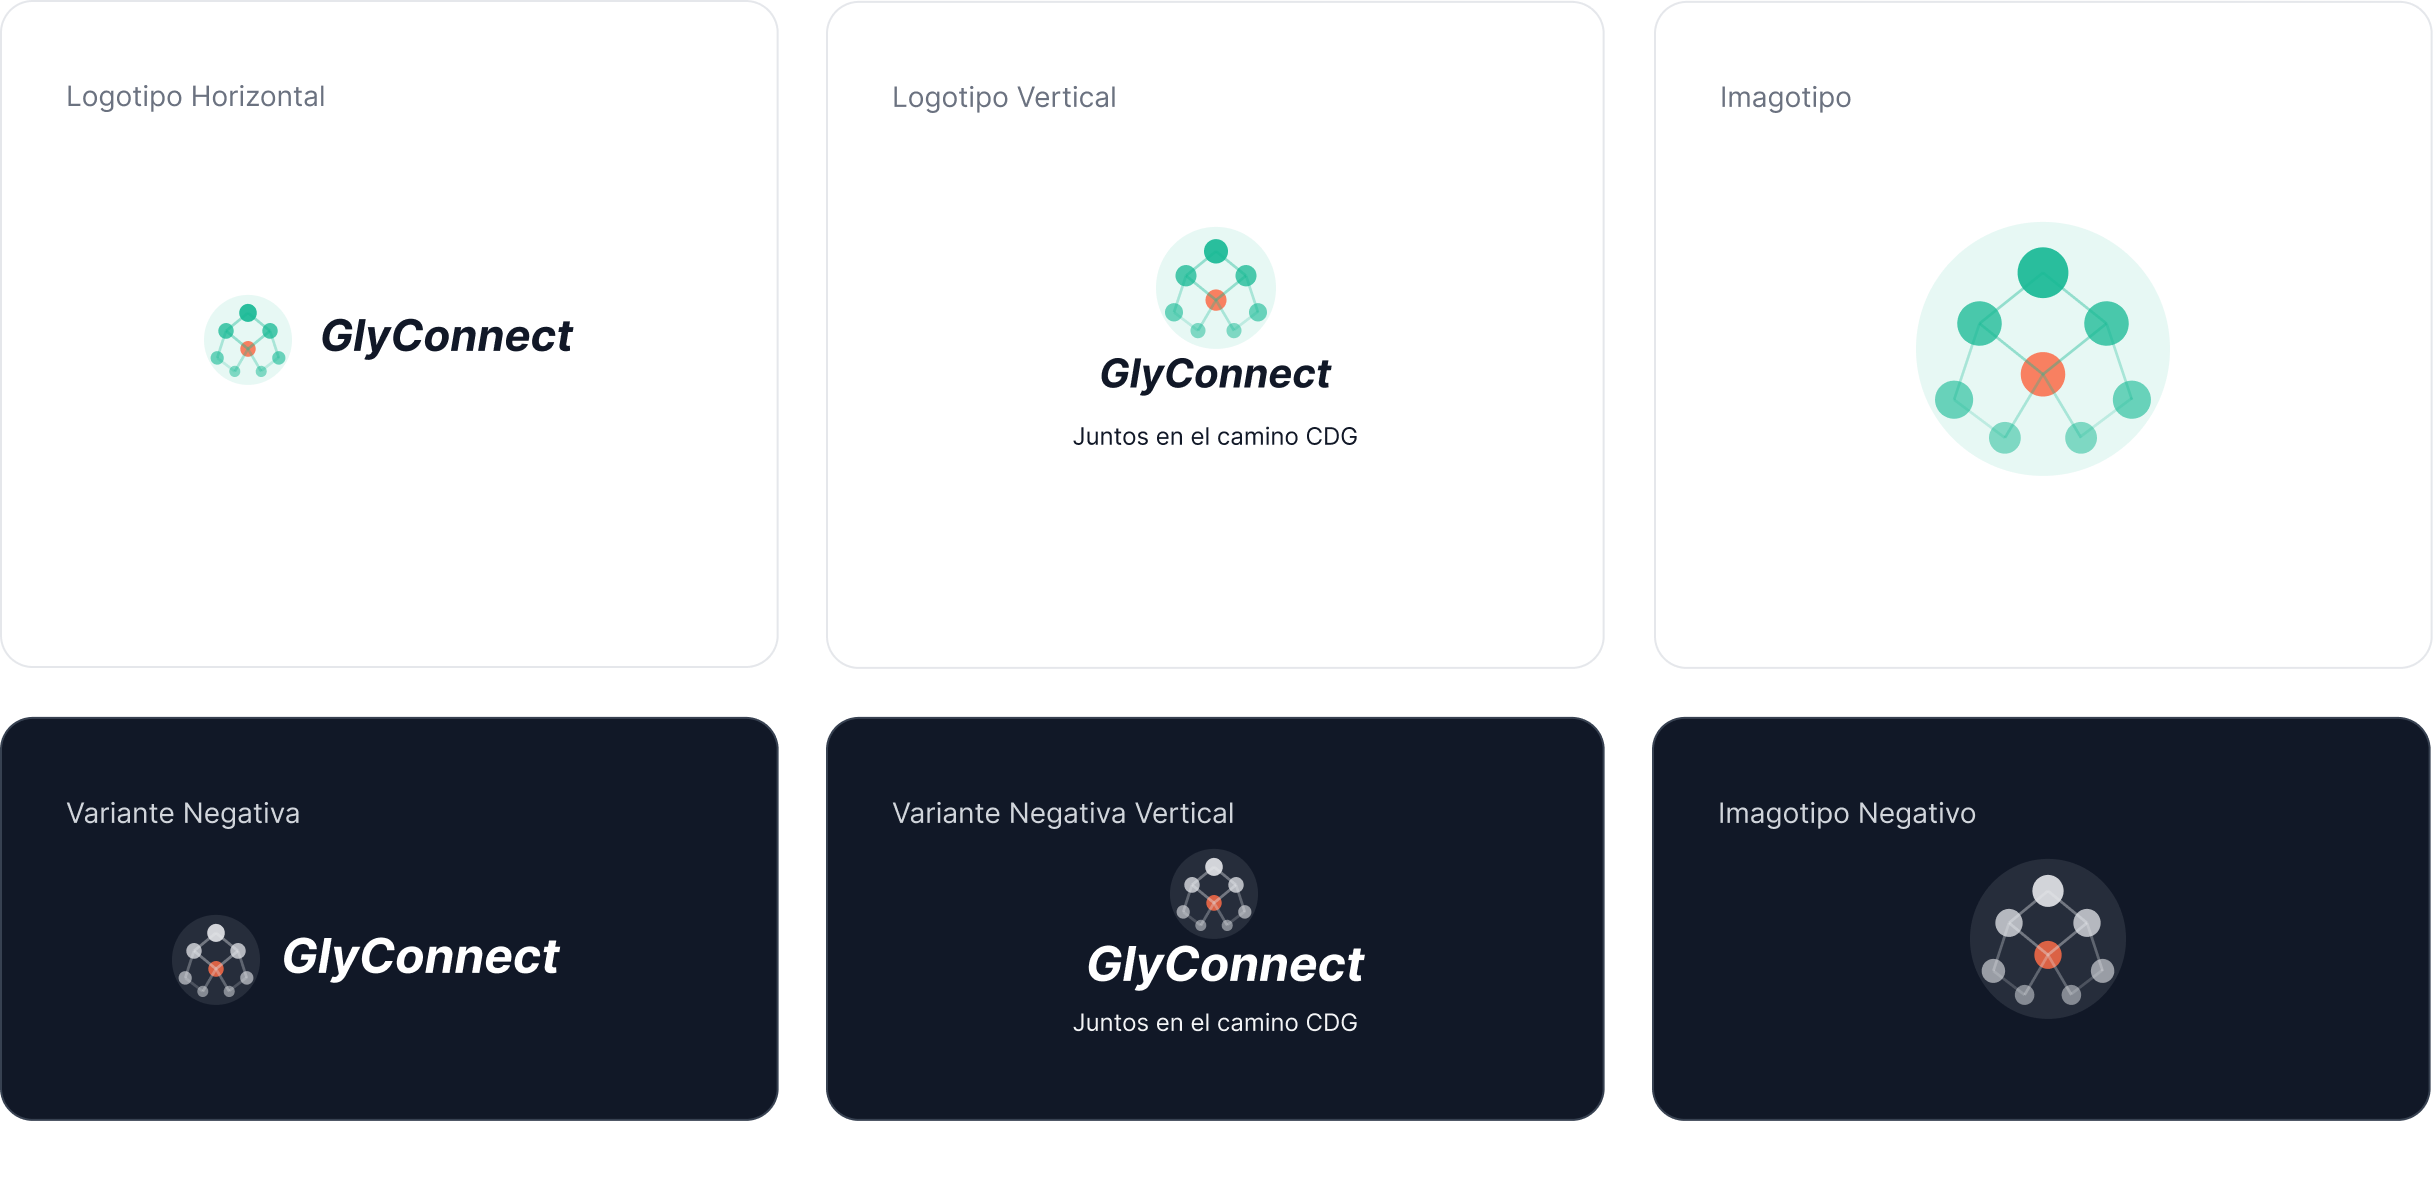
The icon represents the molecular structure of glycans and their bond to proteins (the process affected in CDG), with circles as sugar molecules and lines as chemical bonds. Personally, I didn’t focus much on this, since my priority was getting a prototype together and testing it as soon as possible.

Color
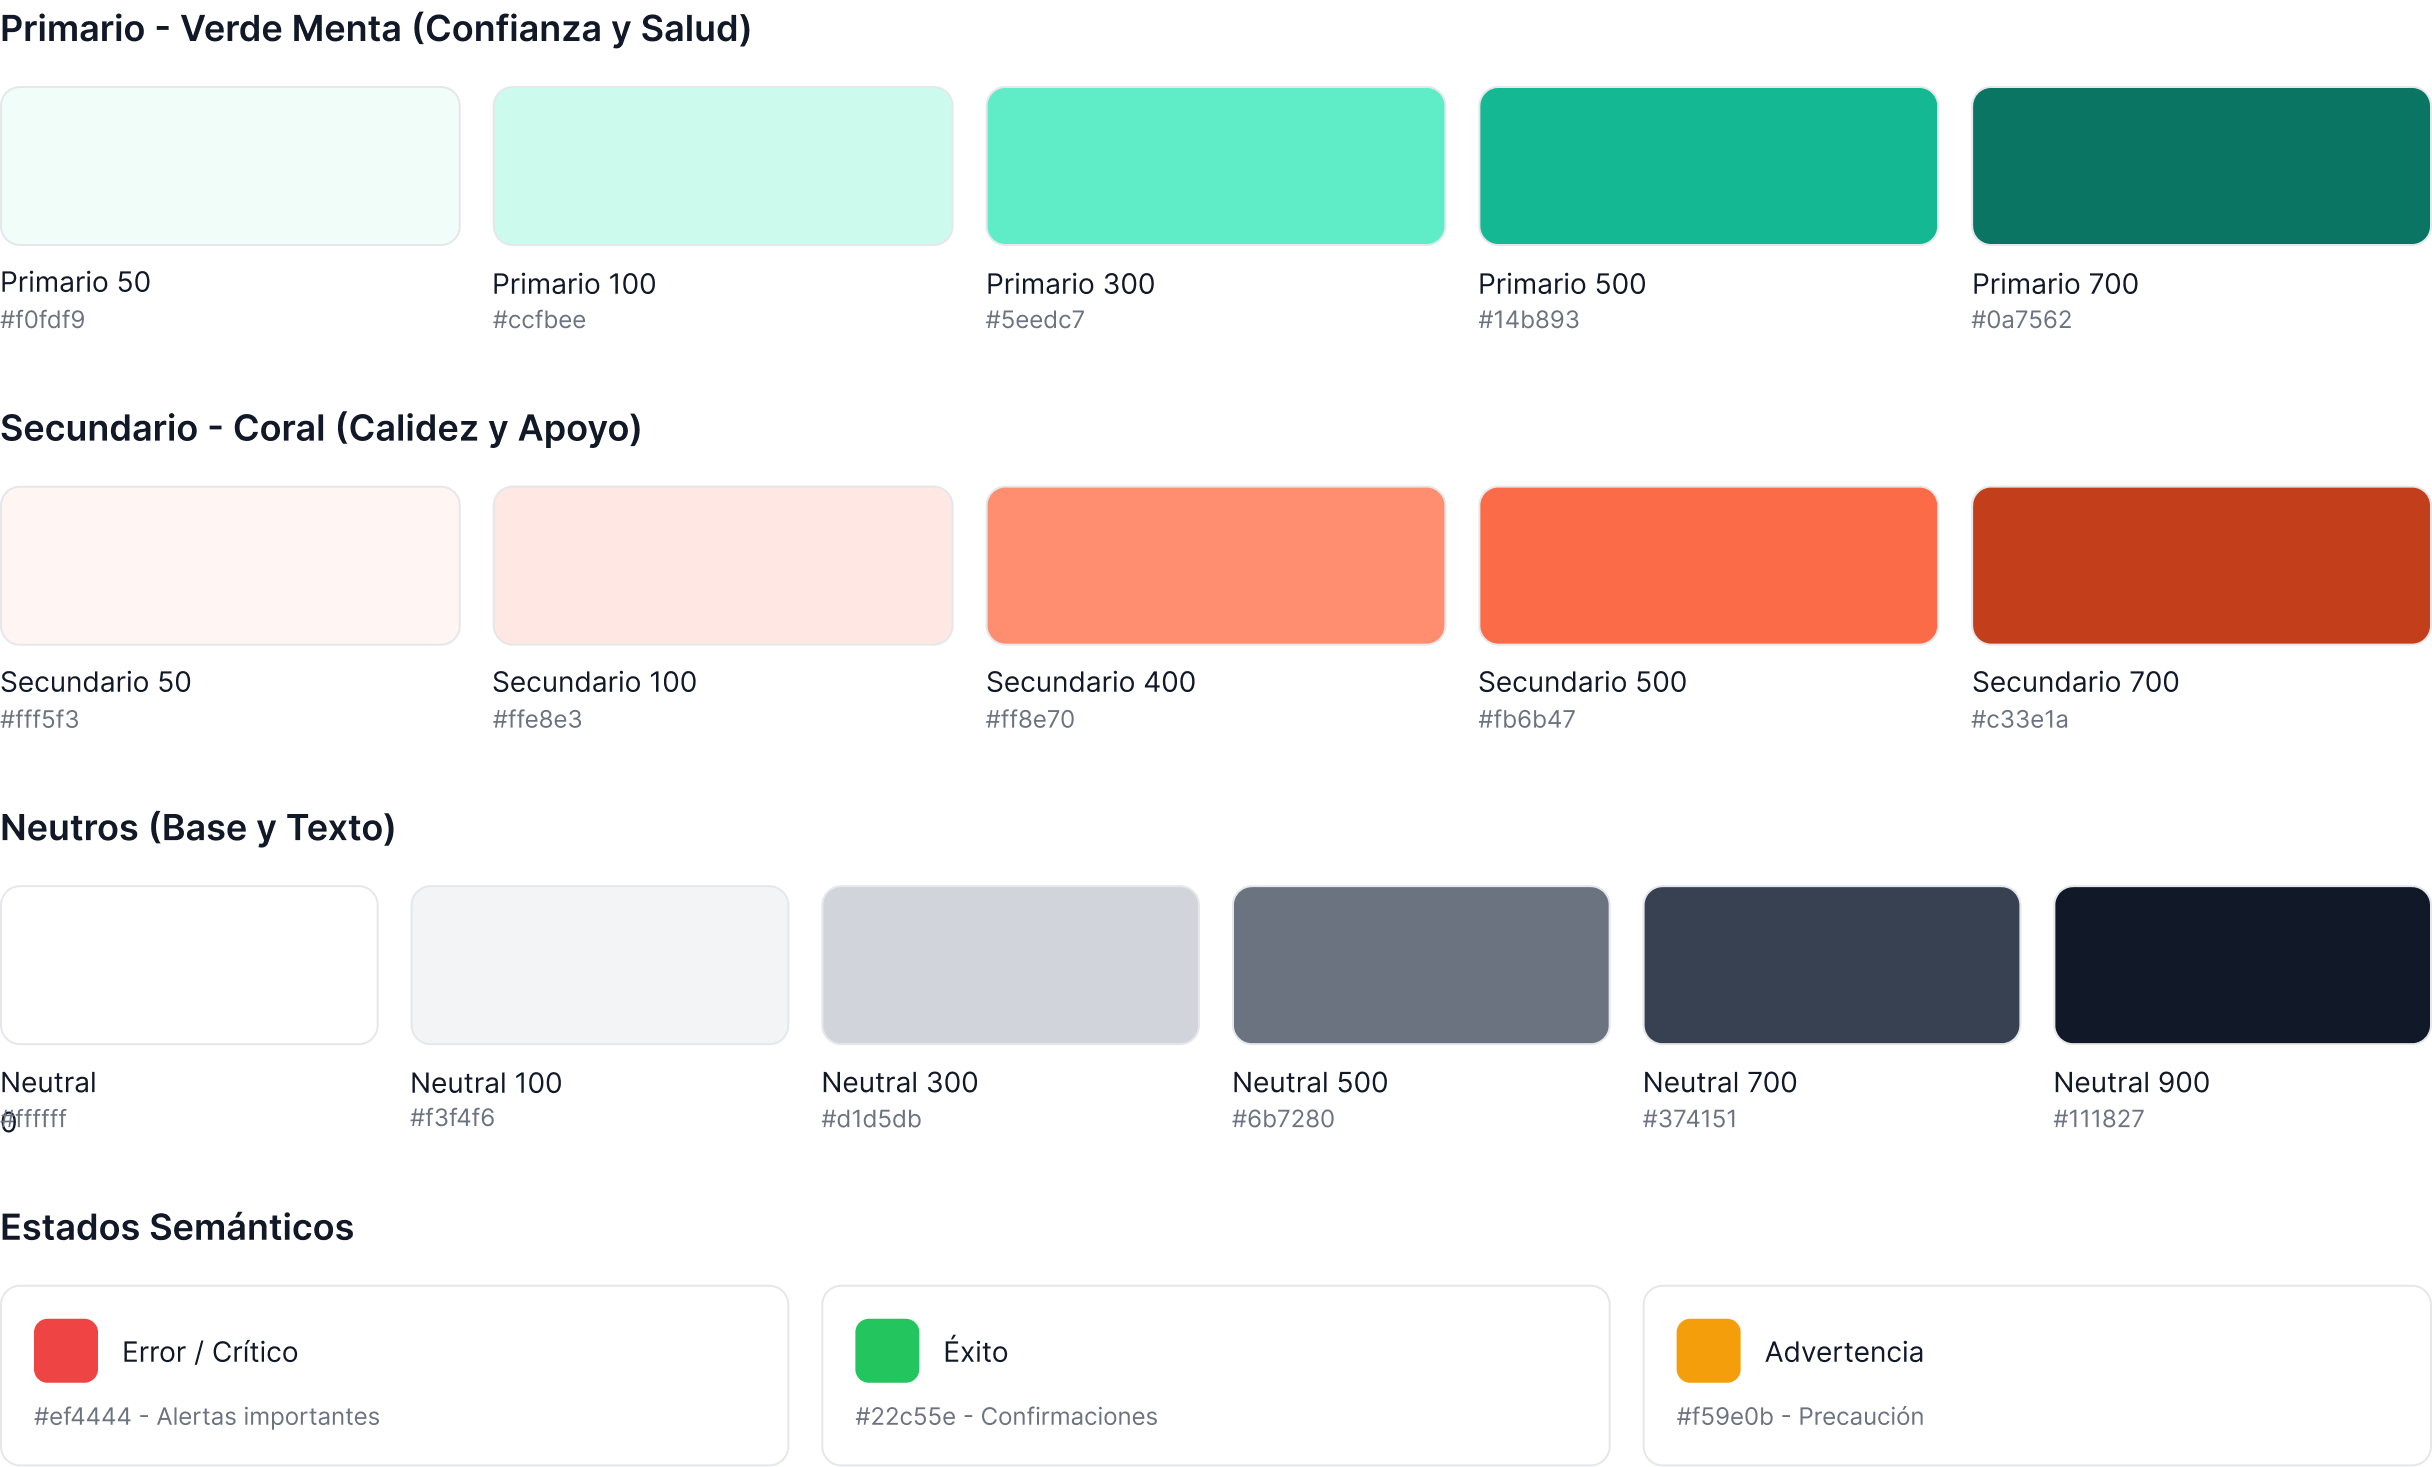
A palette with mint green as primary, coral as secondary, and neutral grays, with variants for light and dark mode.

Typography
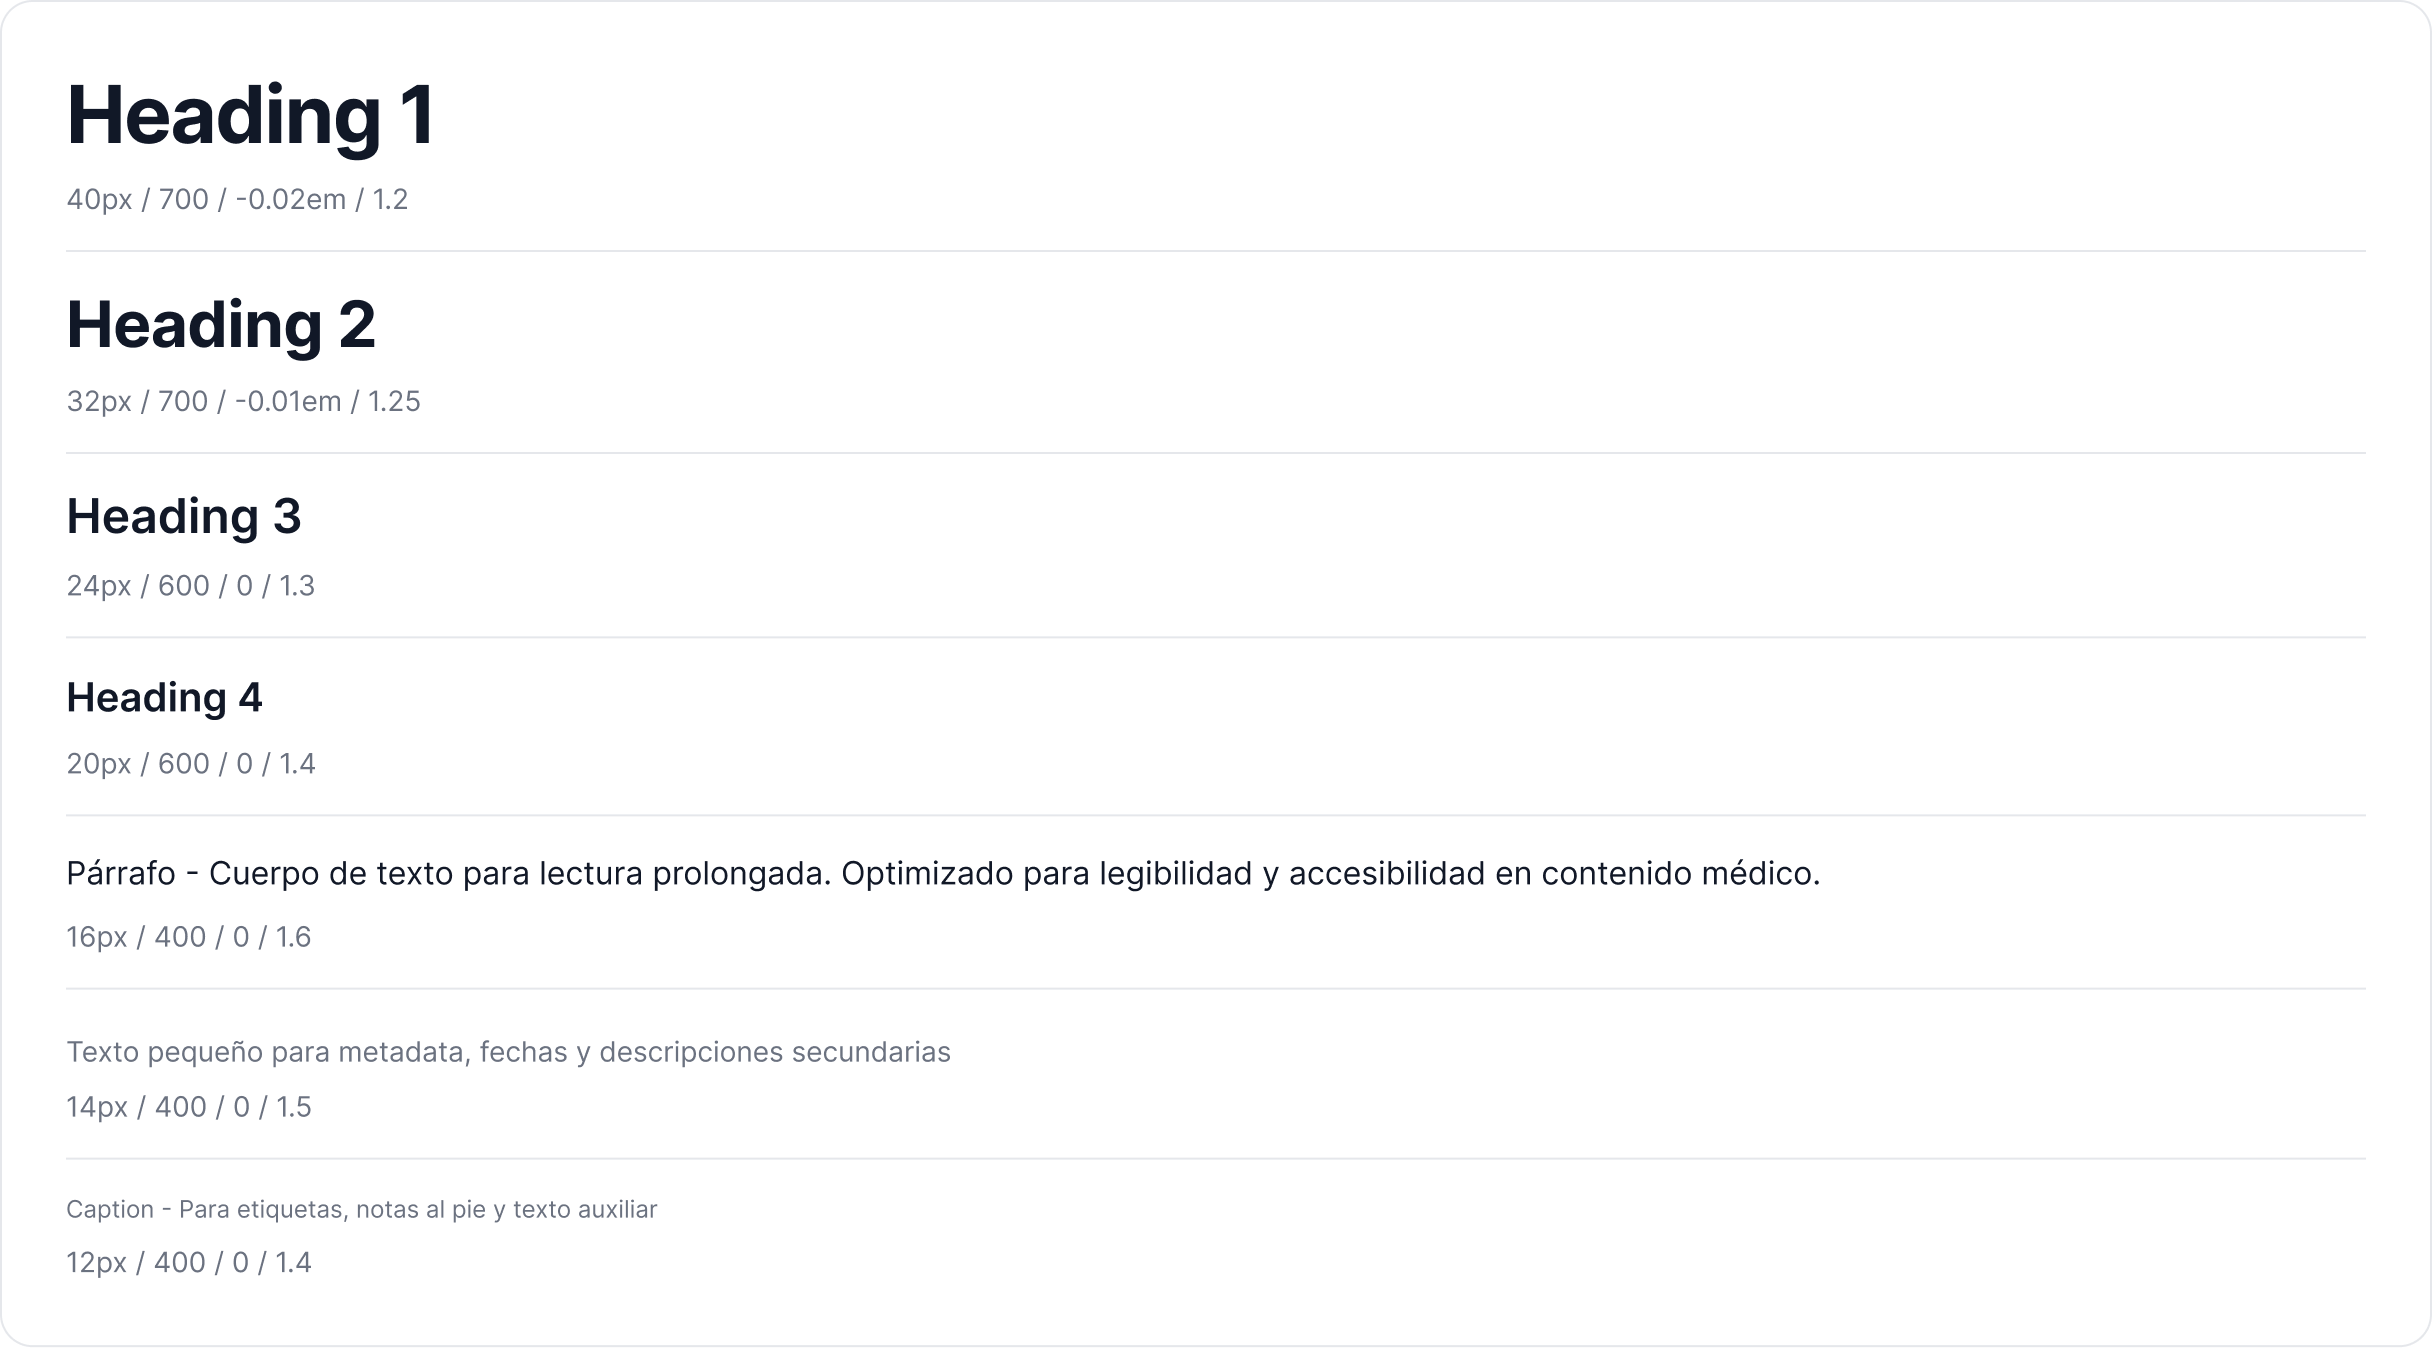
Inter, chosen for its readability, with a defined scale (H1 40 px … body copy 16 px / 1.6 line-height optimized for extended reading of medical content).

Spacing and grid
A base-4 system (4 → 64 px) and a responsive 12 / 8 / 4 column grid (desktop / tablet / mobile).

Components and iconography
Buttons (primary, secondary, critical), selection, form fields with validation states; and an icon set for health, community, calendar, report, settings, and the CDG molecule.

Accessibility (WCAG 2.1 AA).
Guaranteed contrast ratios (text on white 4.8:1; on dark 16.4:1 AAA), a minimum 44×44 px tap area, text resizable up to 200%, not relying on color alone, visible focus states, semantic labels, descriptive error messages.

Mascot
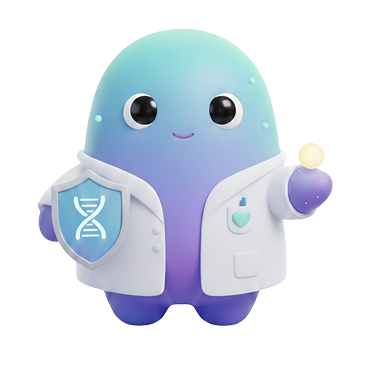
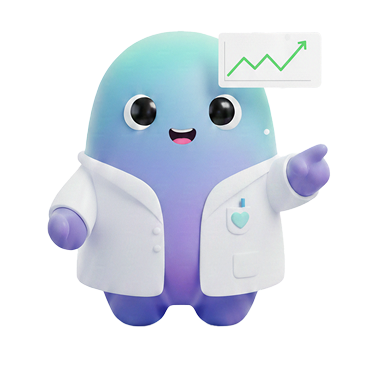
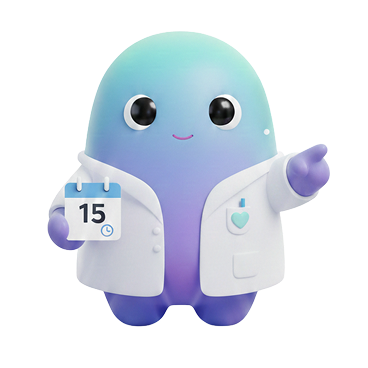
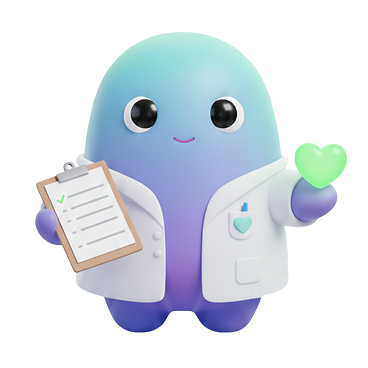
We added a mascot as an emotional companion element, to humanize the interface and soften the experience in such a sensitive context, without getting in the way of functionality.

From sketch to prototype

The design evolved through increasing levels of fidelity, prioritizing information architecture and usability over aesthetics.

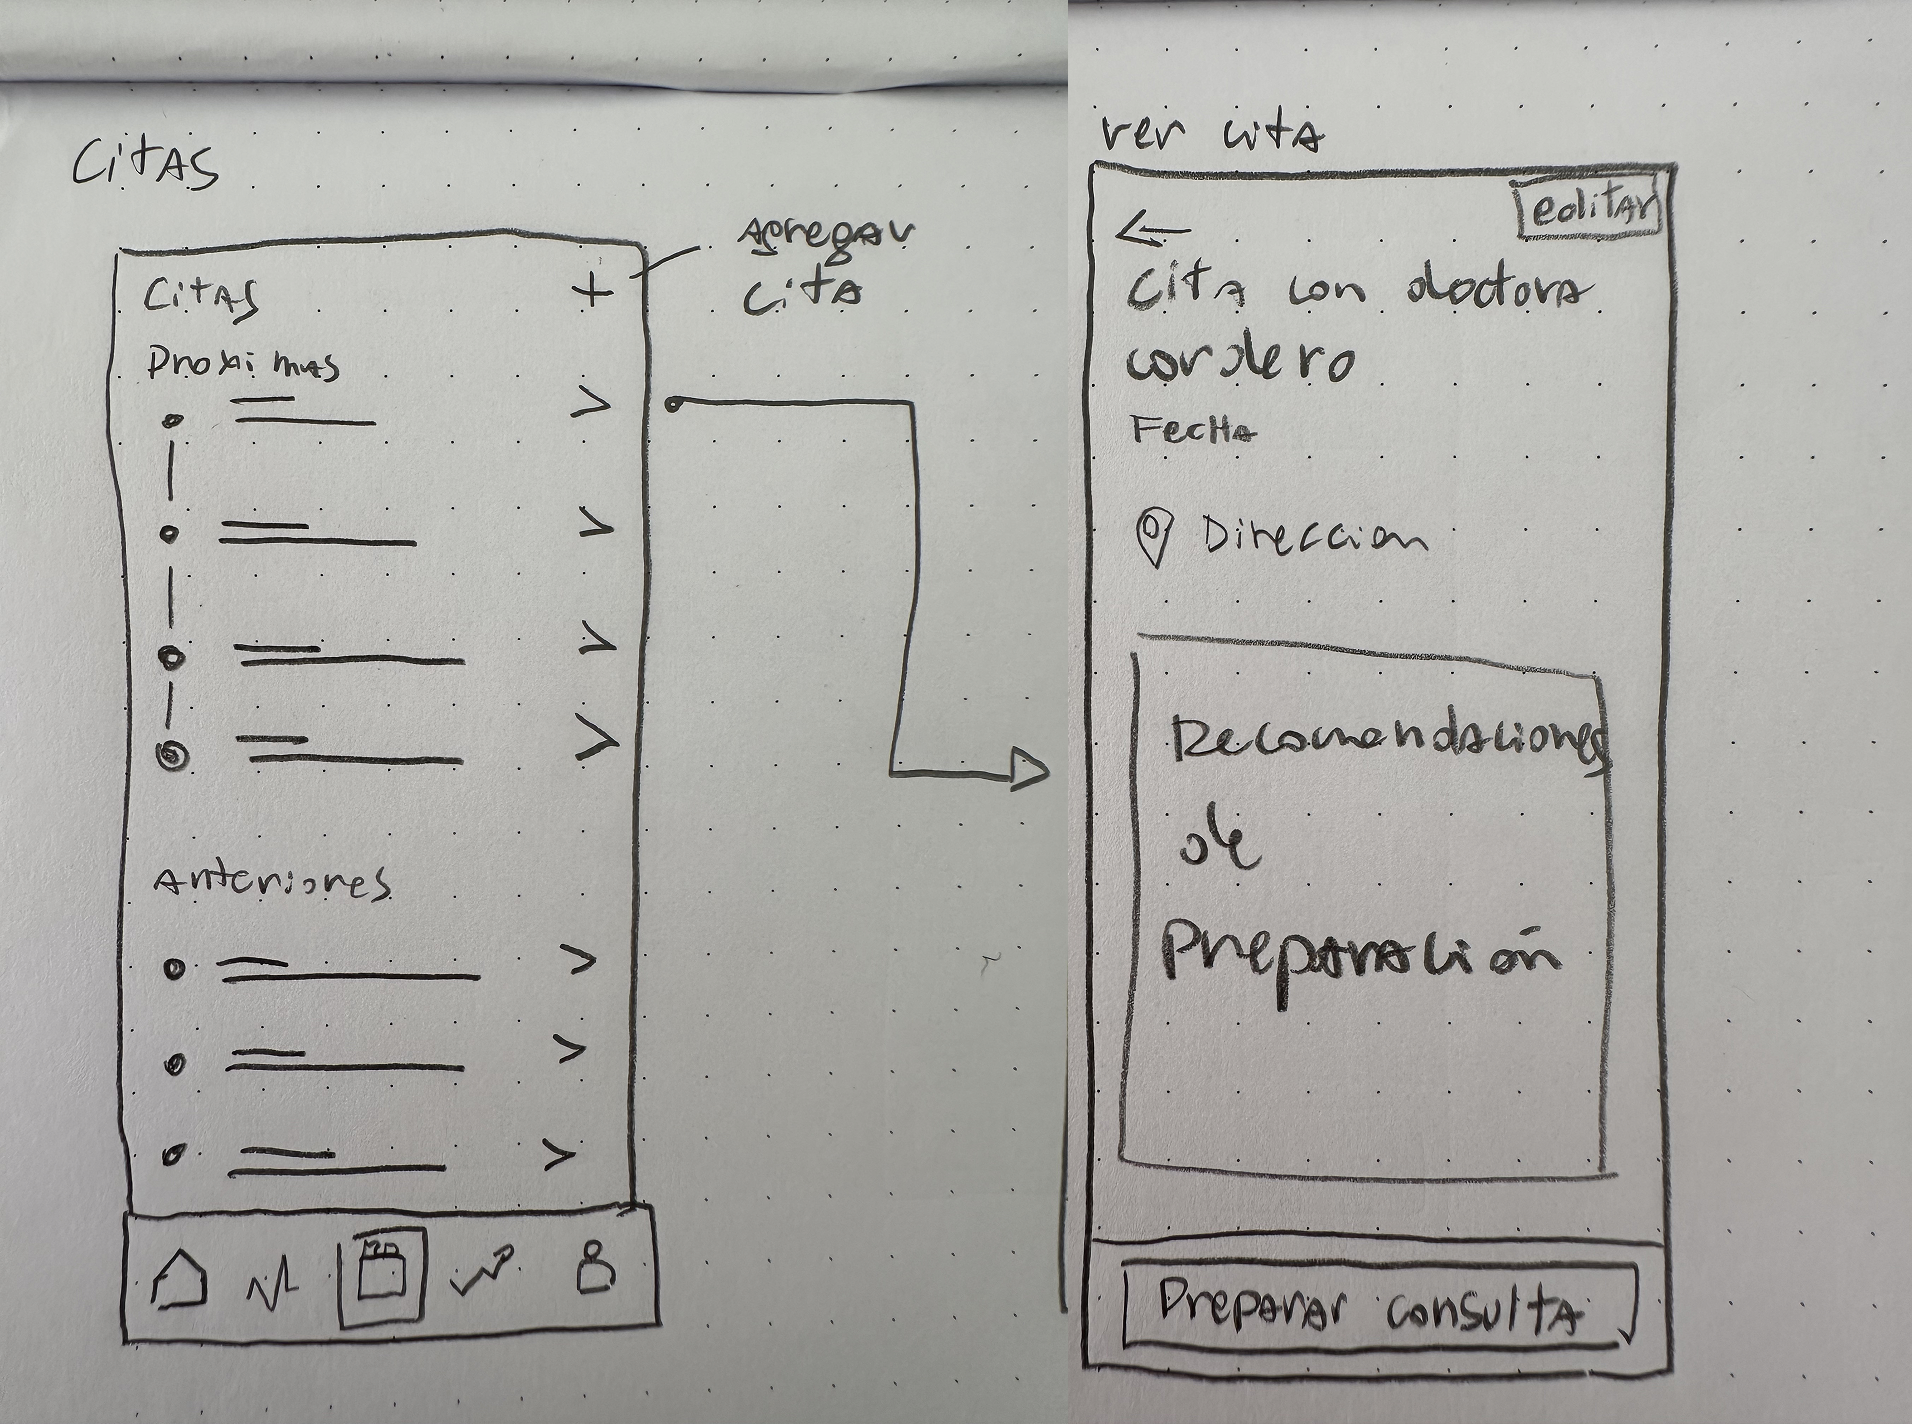
  1. Paper wireframes (lo-fi)
    Quick exploration of structure, hierarchy, and flows.
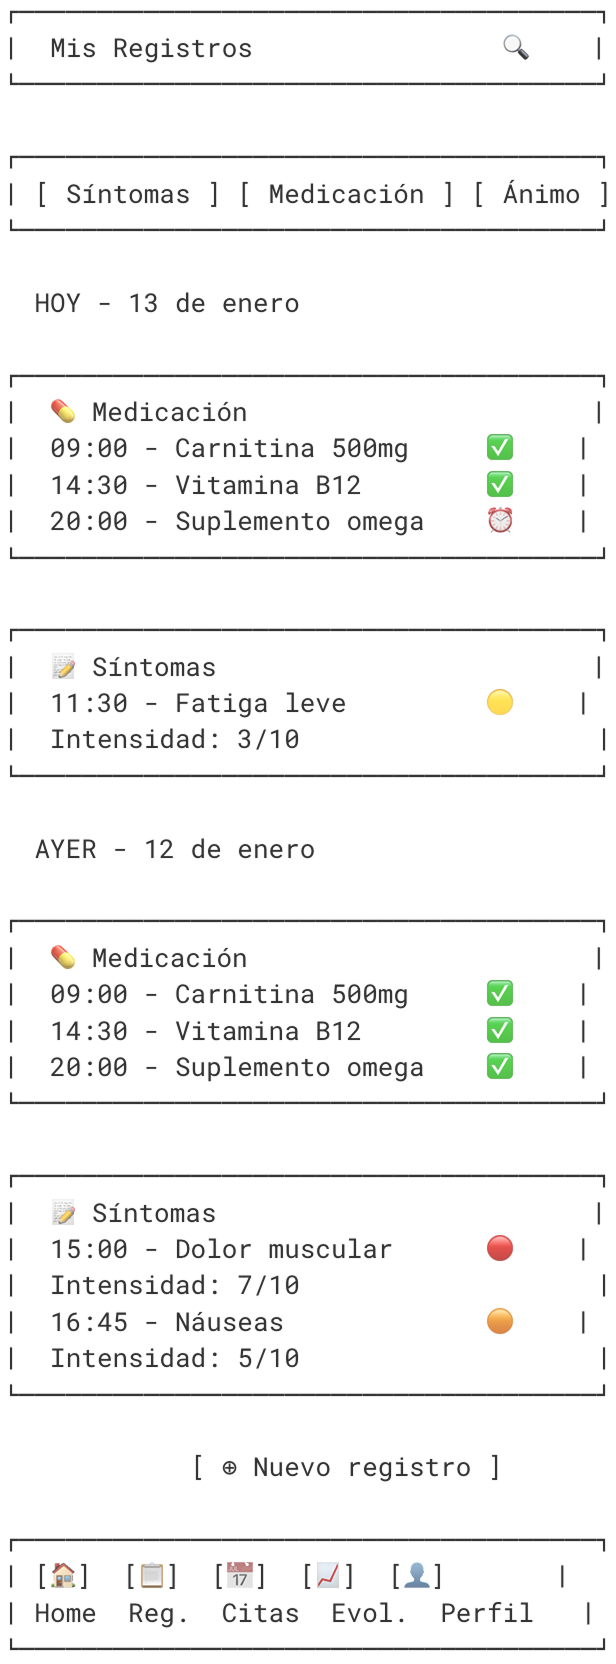
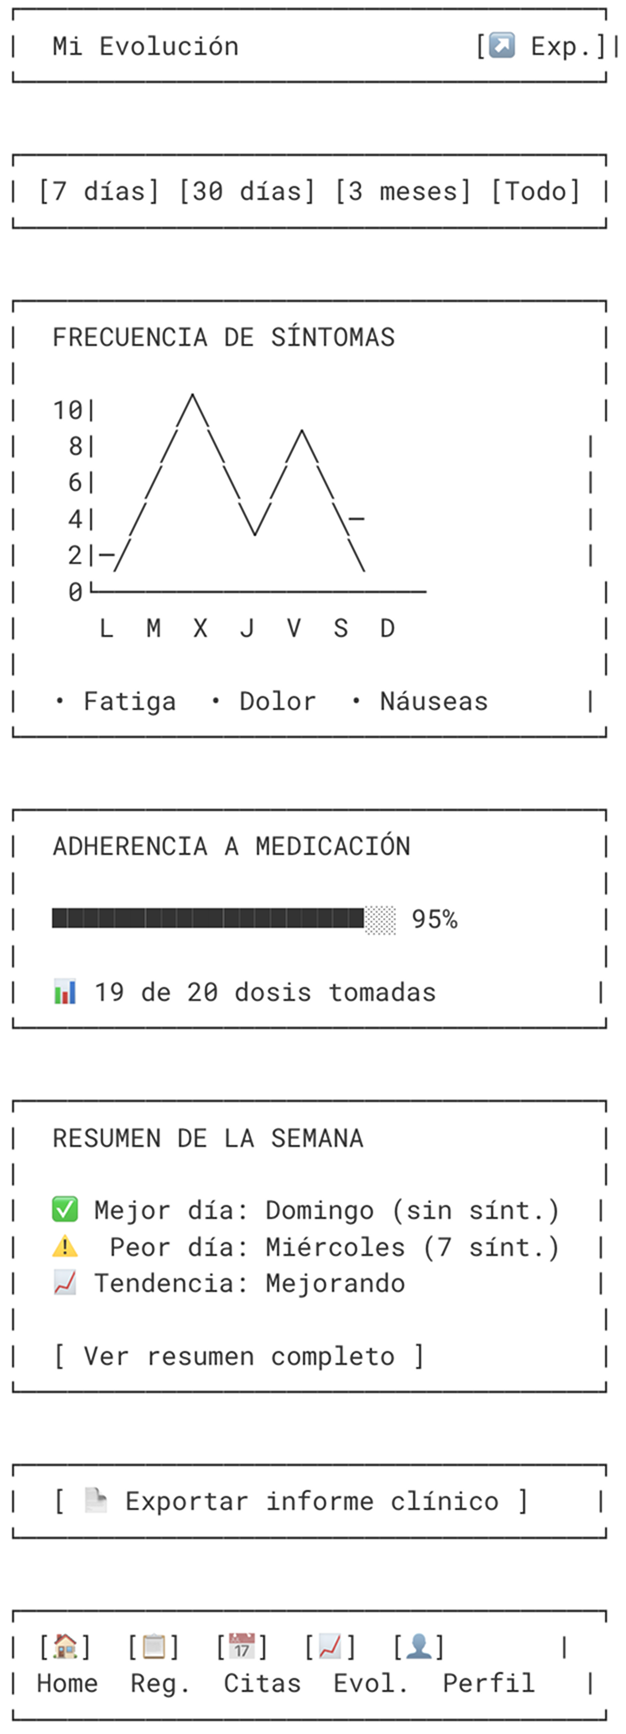
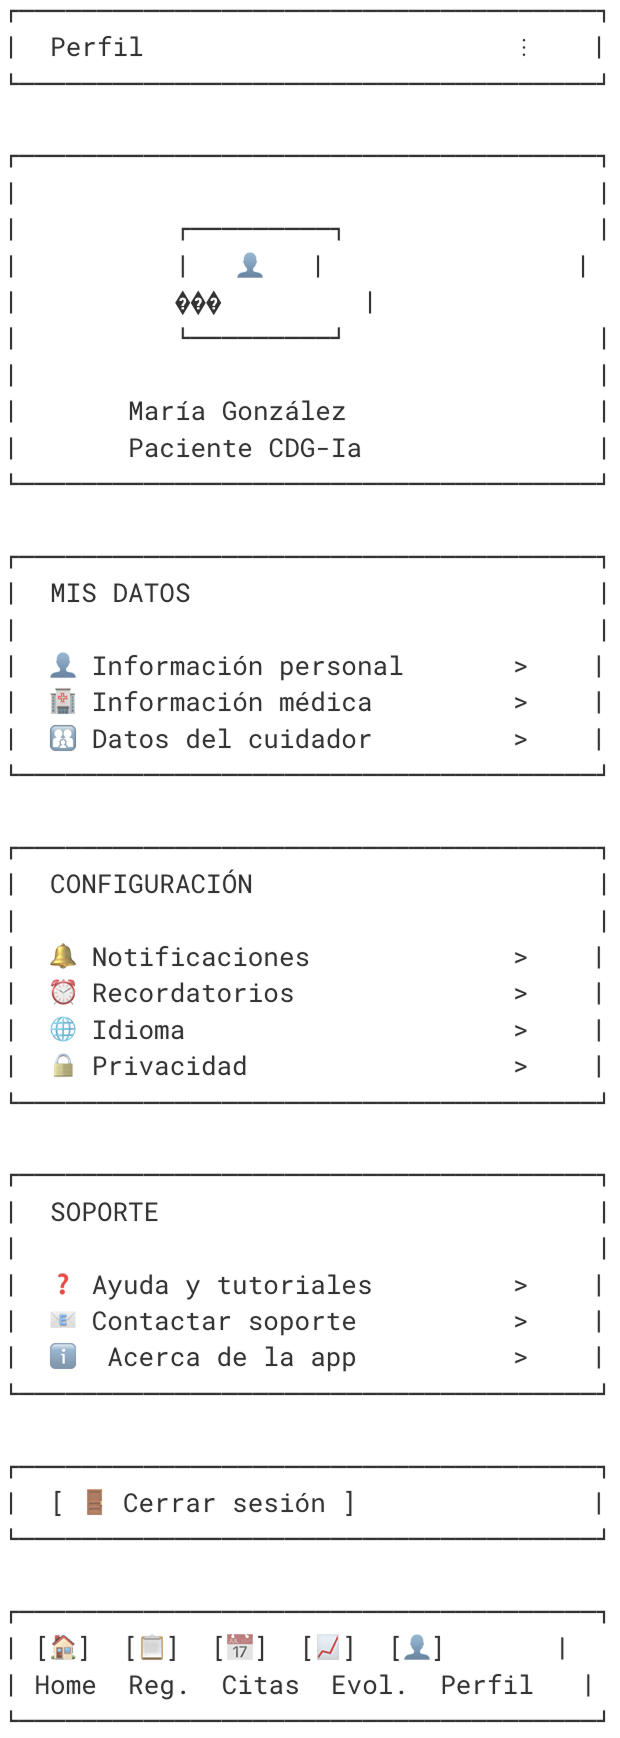
  2. AI-generated ASCII wireframes
    I used generative AI to produce ASCII-format sketches of the app’s structure. It was a fast, powerful way to visualize how sections were organized, set the information hierarchy, and get the team aligned before investing time in Figma.
  3. Digital (mid-fi) wireframes in Figma
    I moved the sketches to digital to work out layout, navigation, and functional coherence in more detail.
  4. High-fidelity prototype (v1)
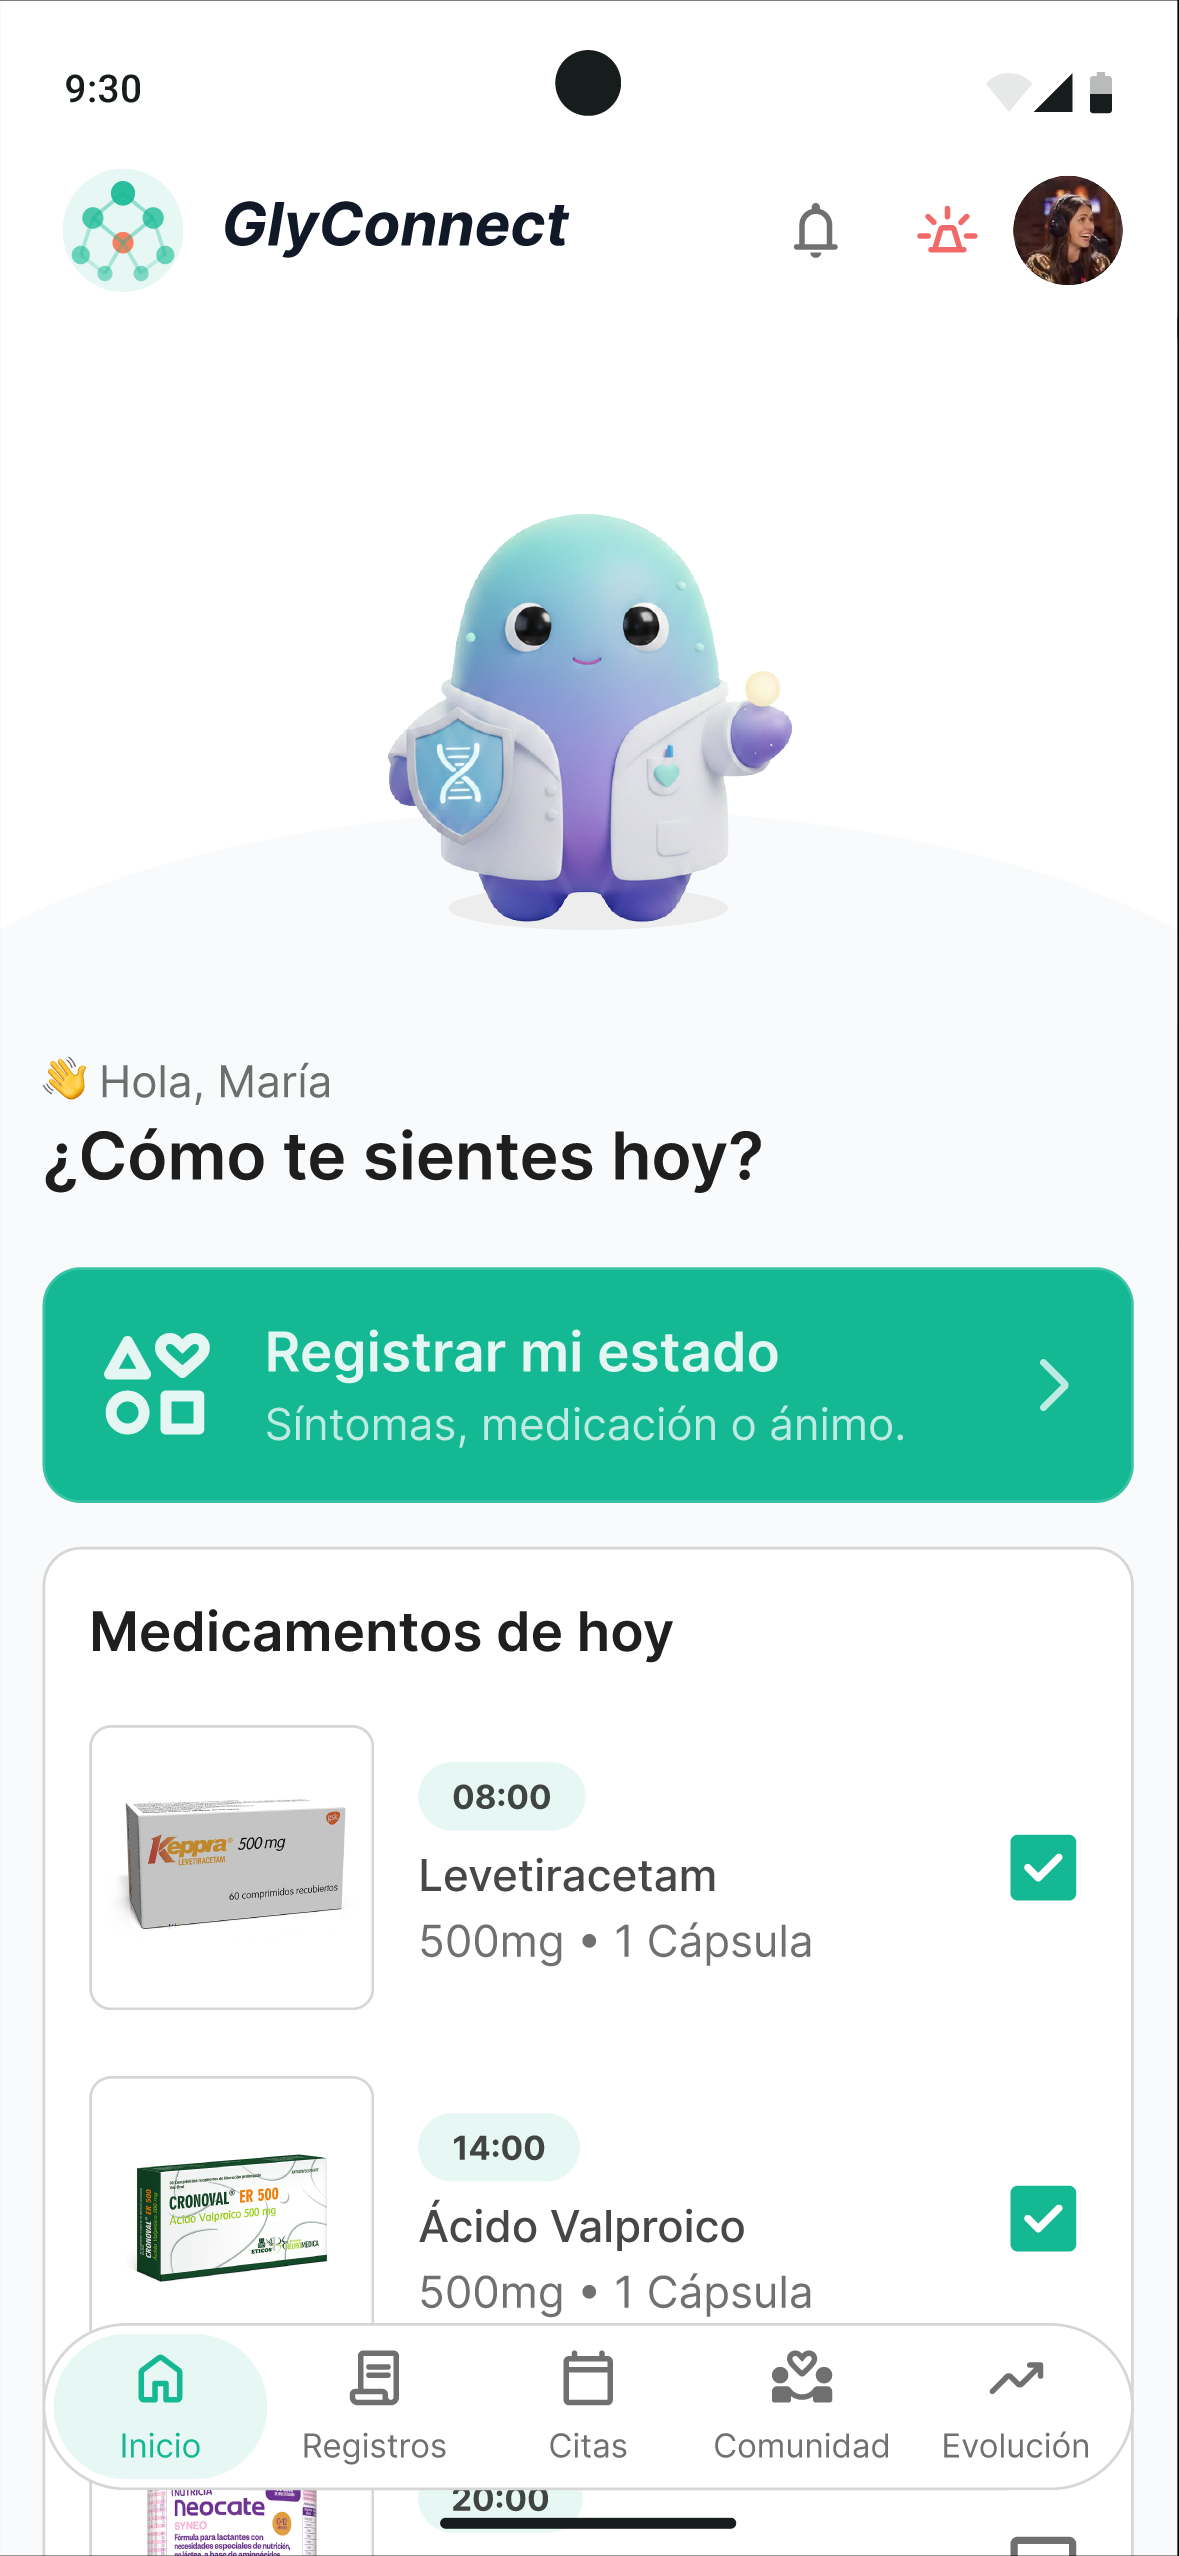
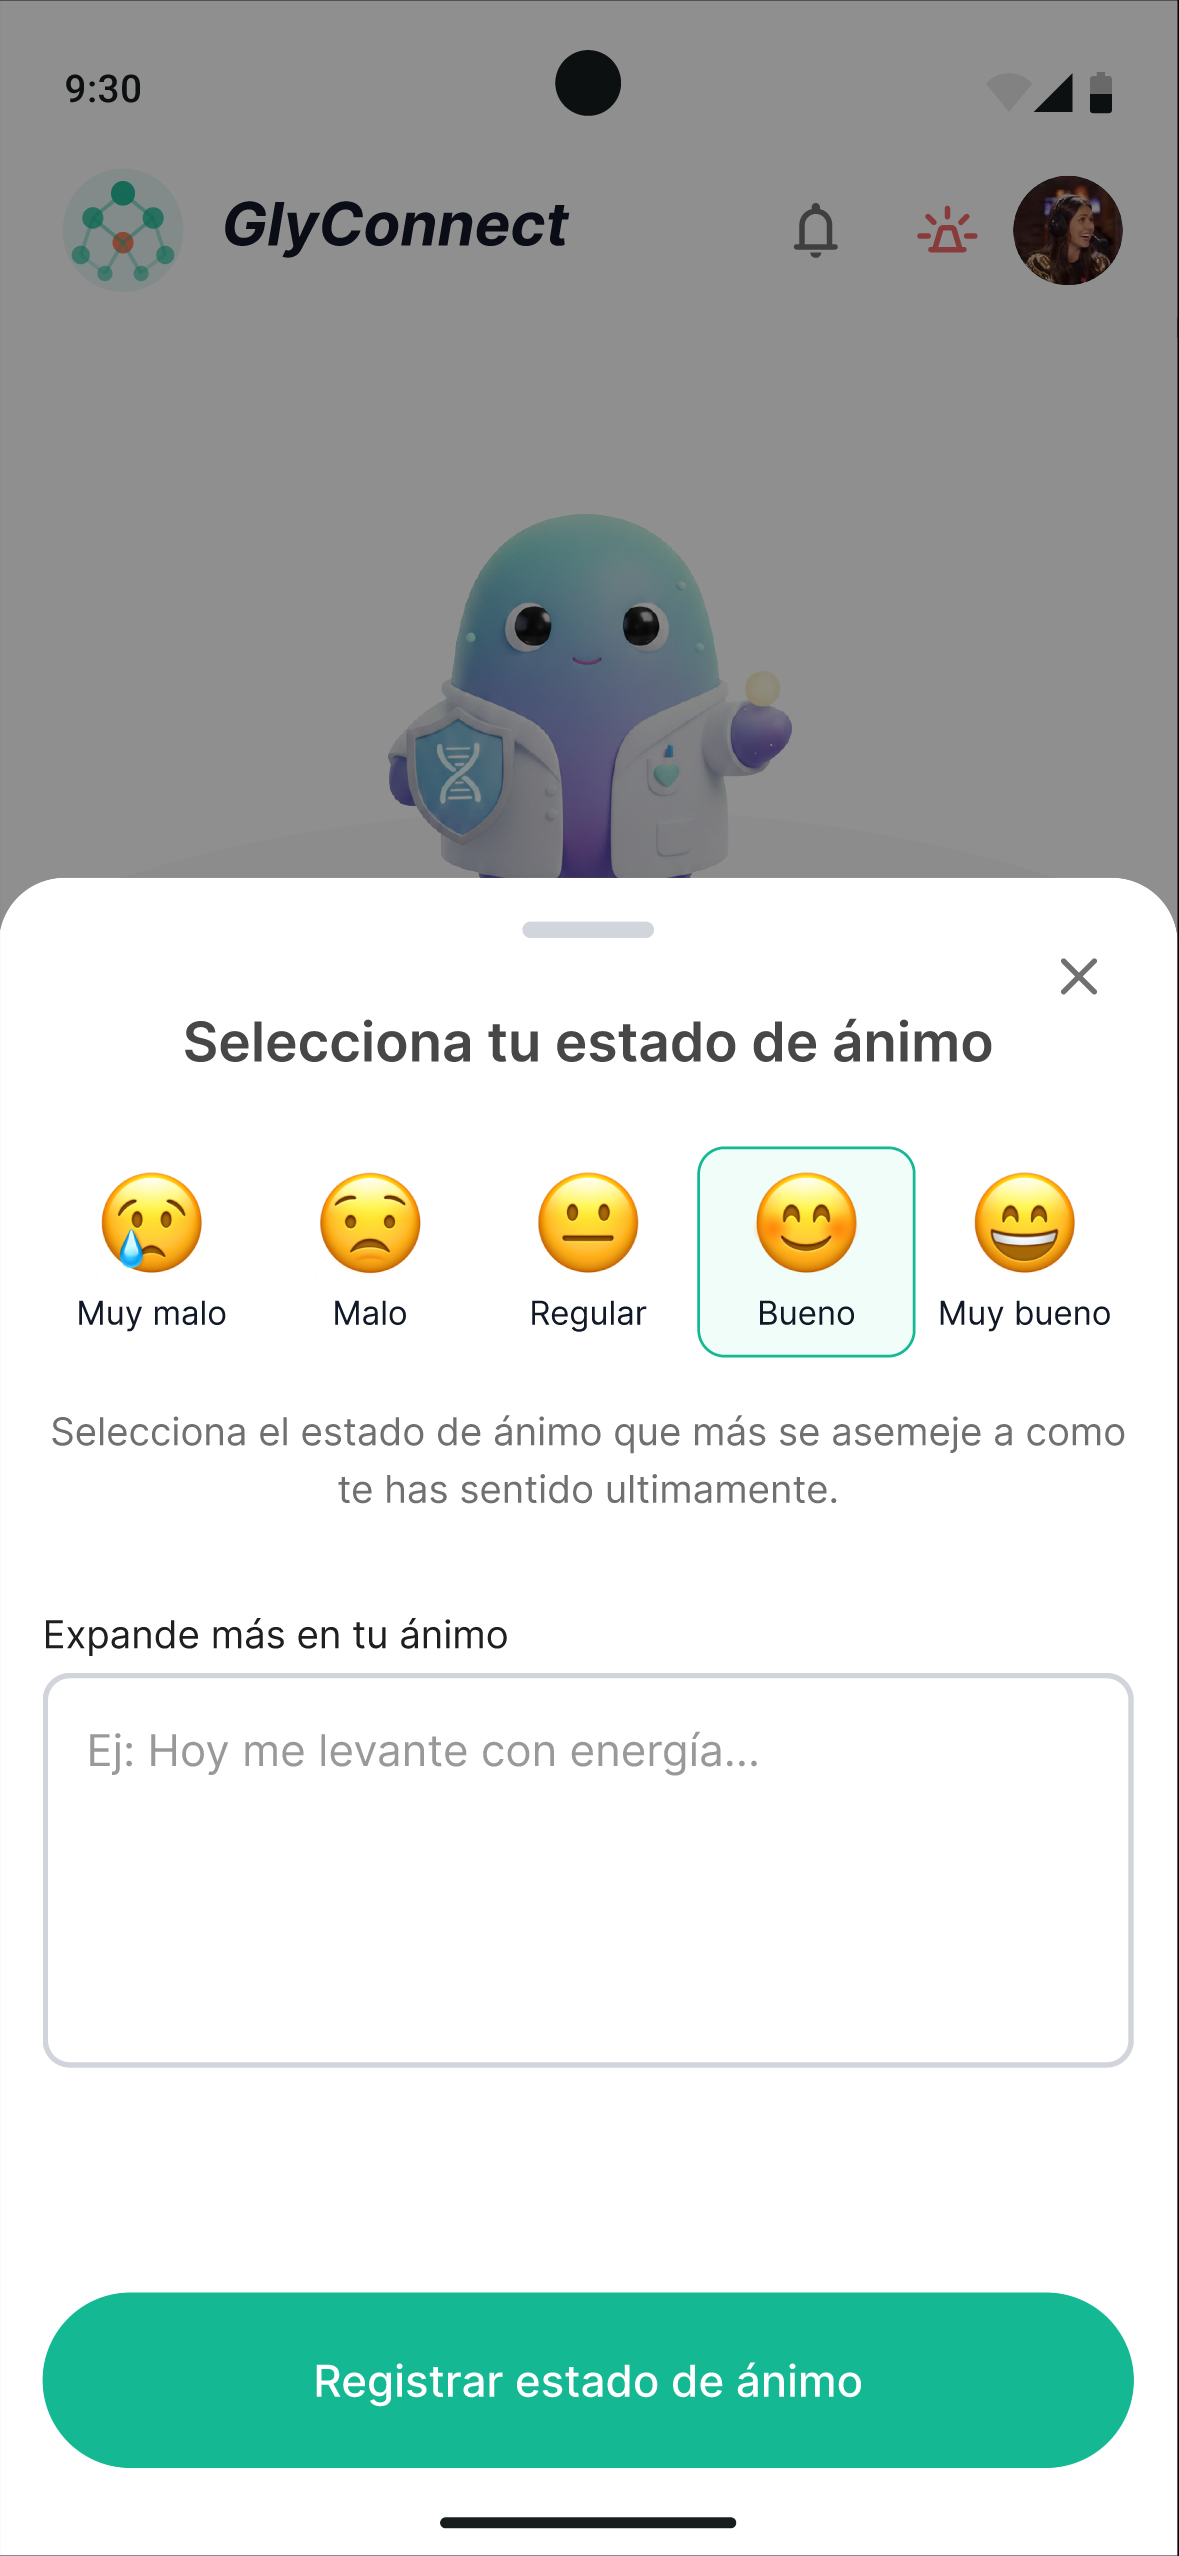
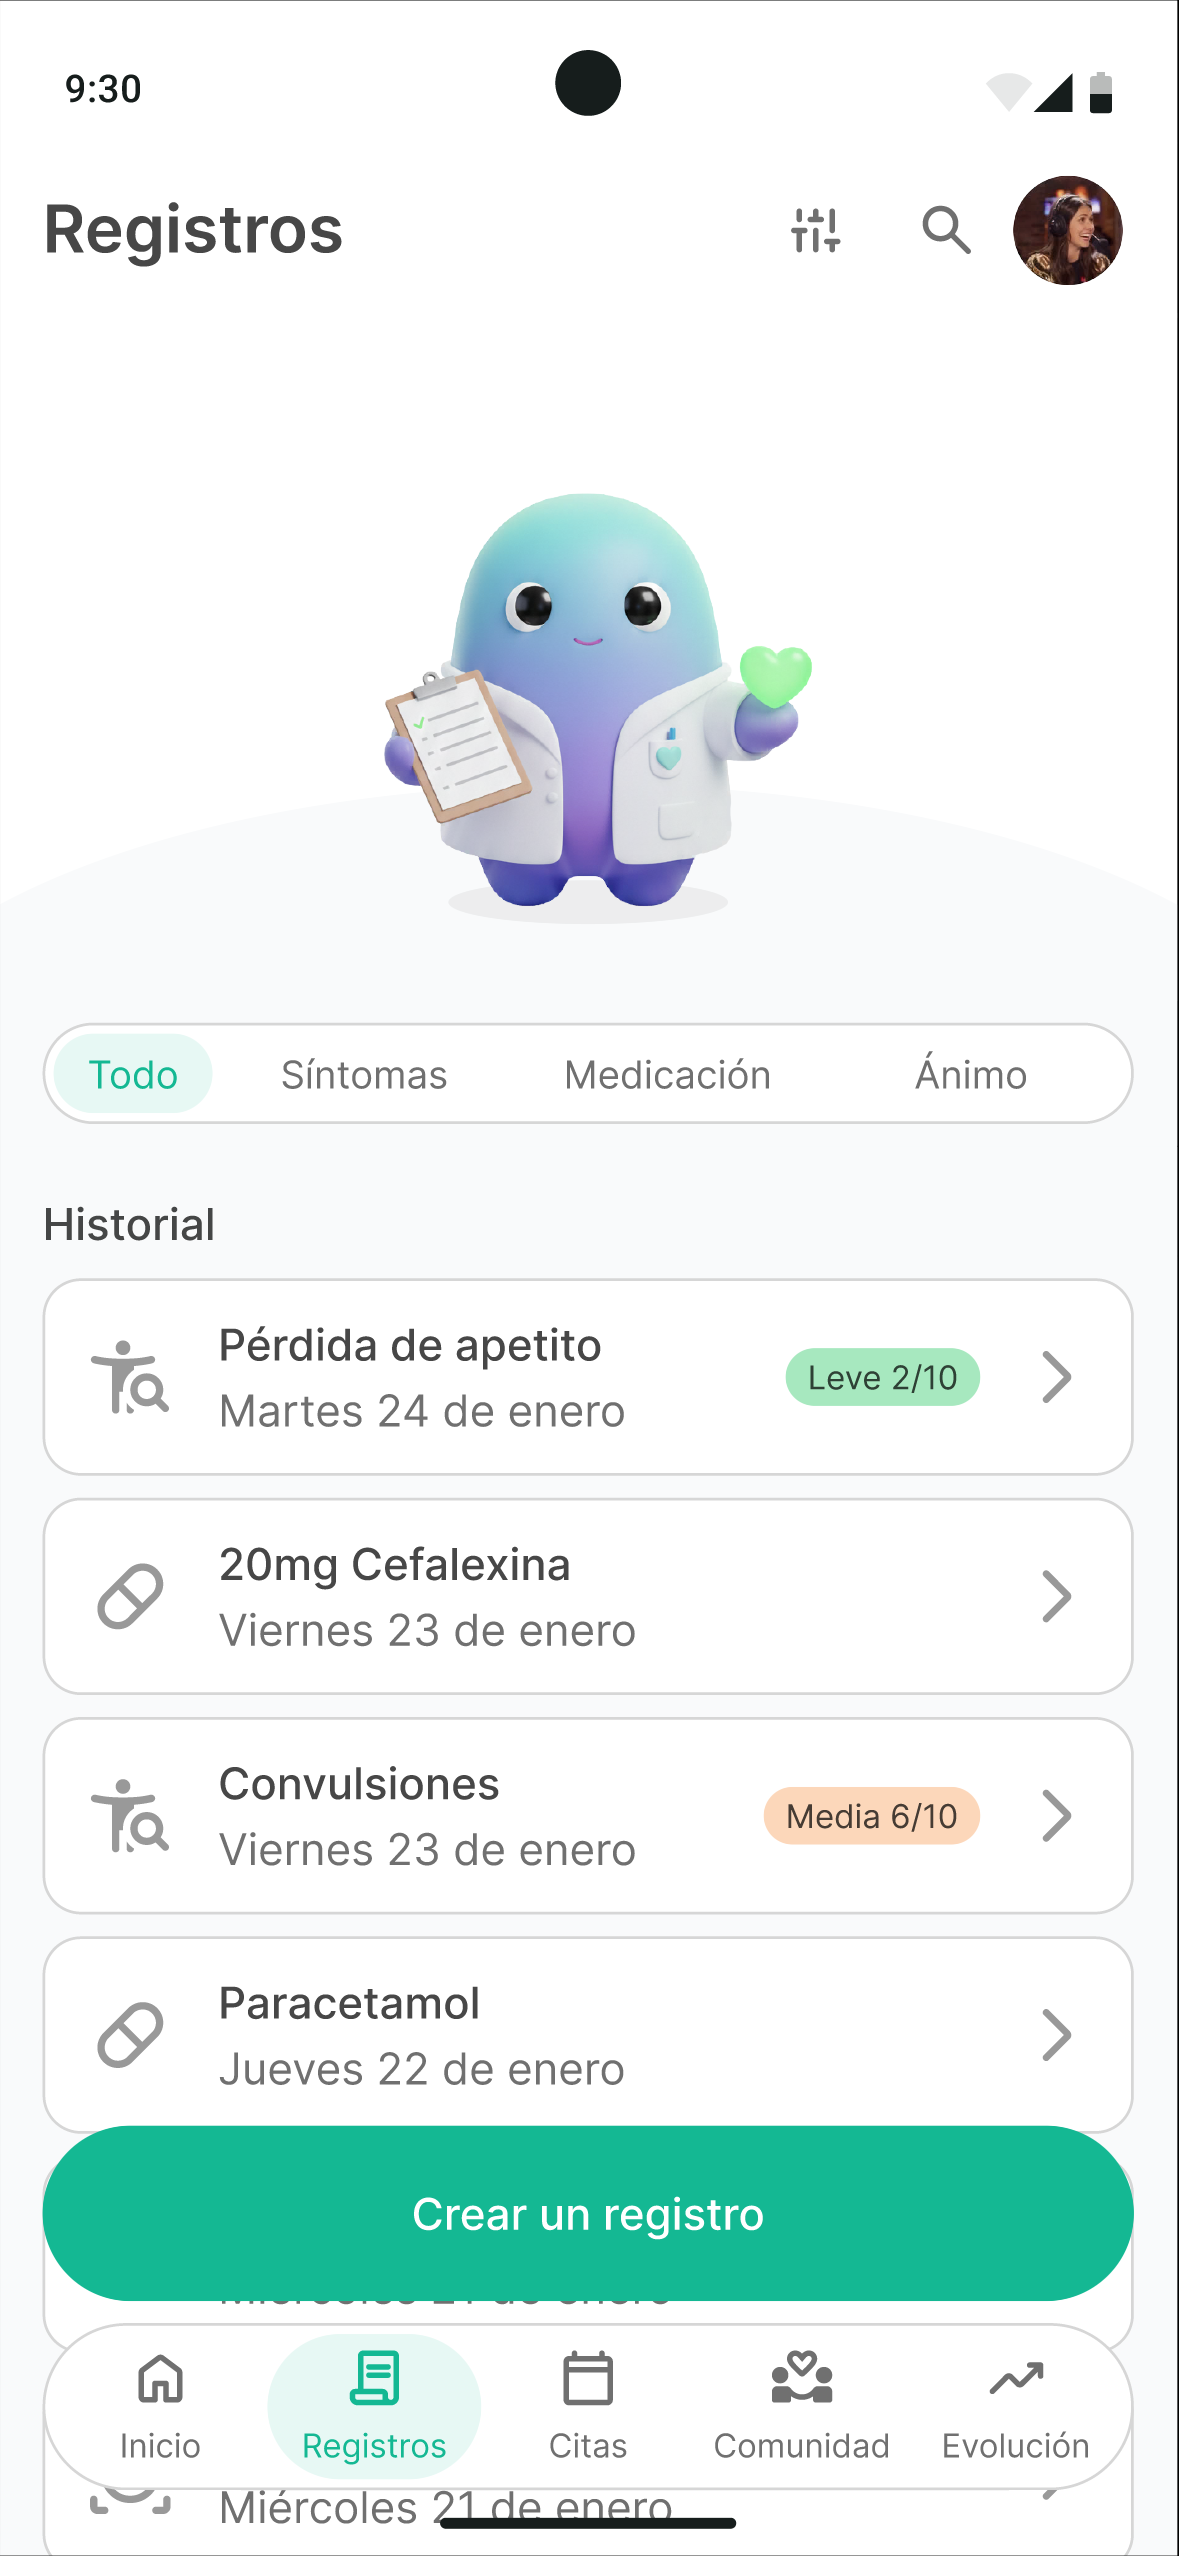
    Explicitly conceived as a conversation tool, not a finished solution: built to listen to and check against the CDG community. It covered the representative home, data-logging, and progress screens, with the design system applied.

Paper wireframes

ASCII wireframes

High-fidelity prototype (v1)

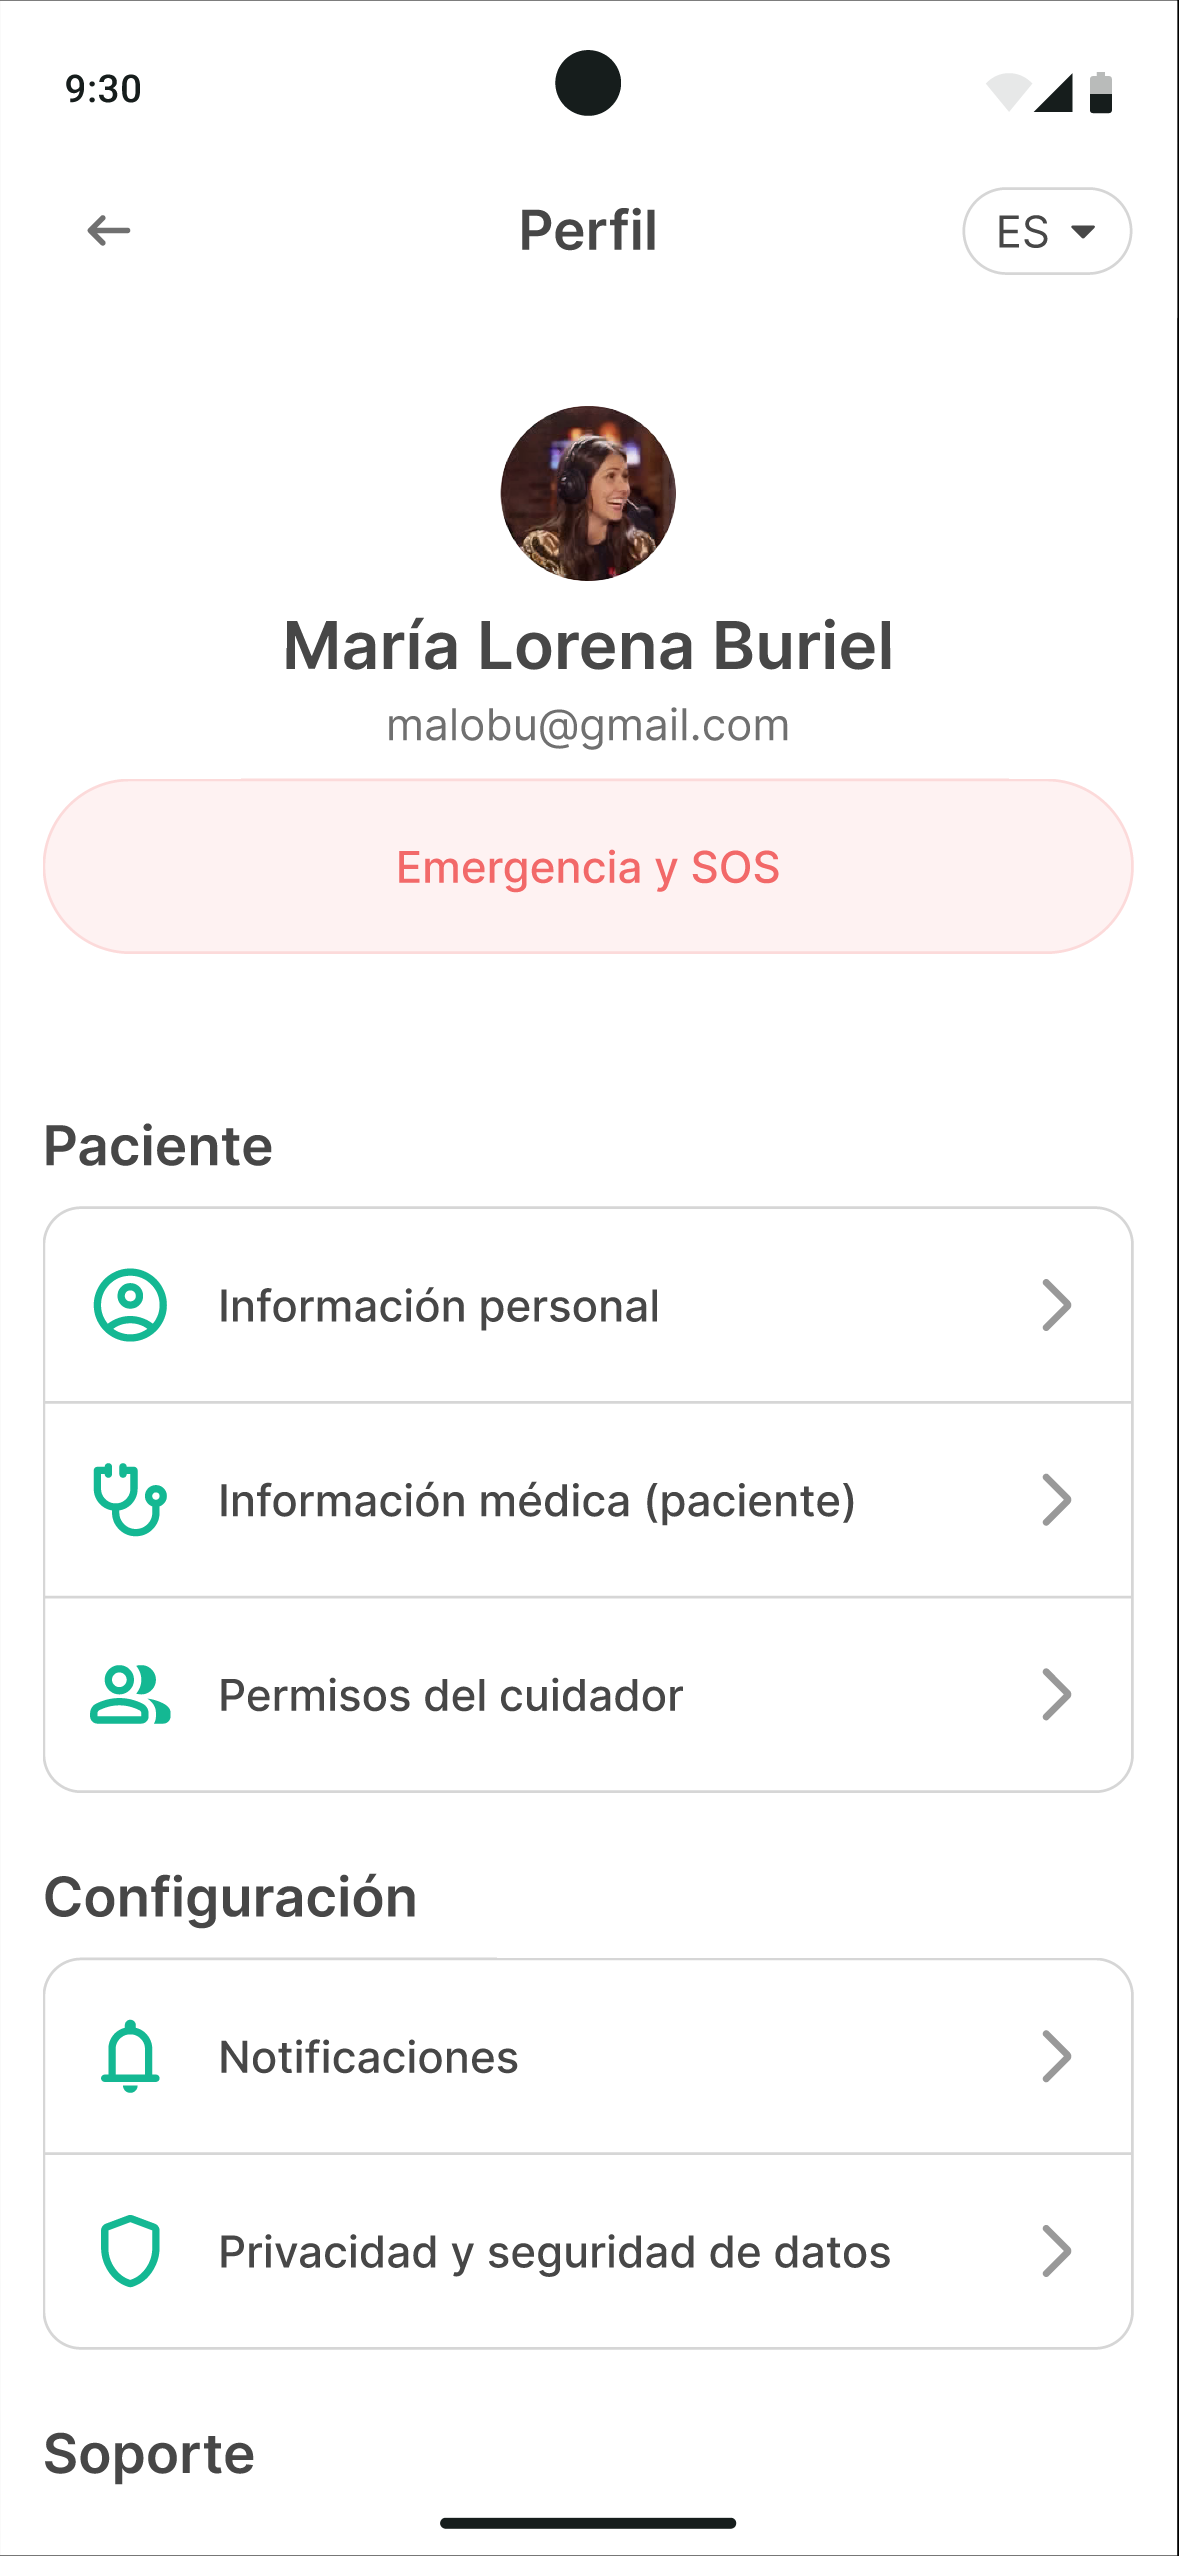
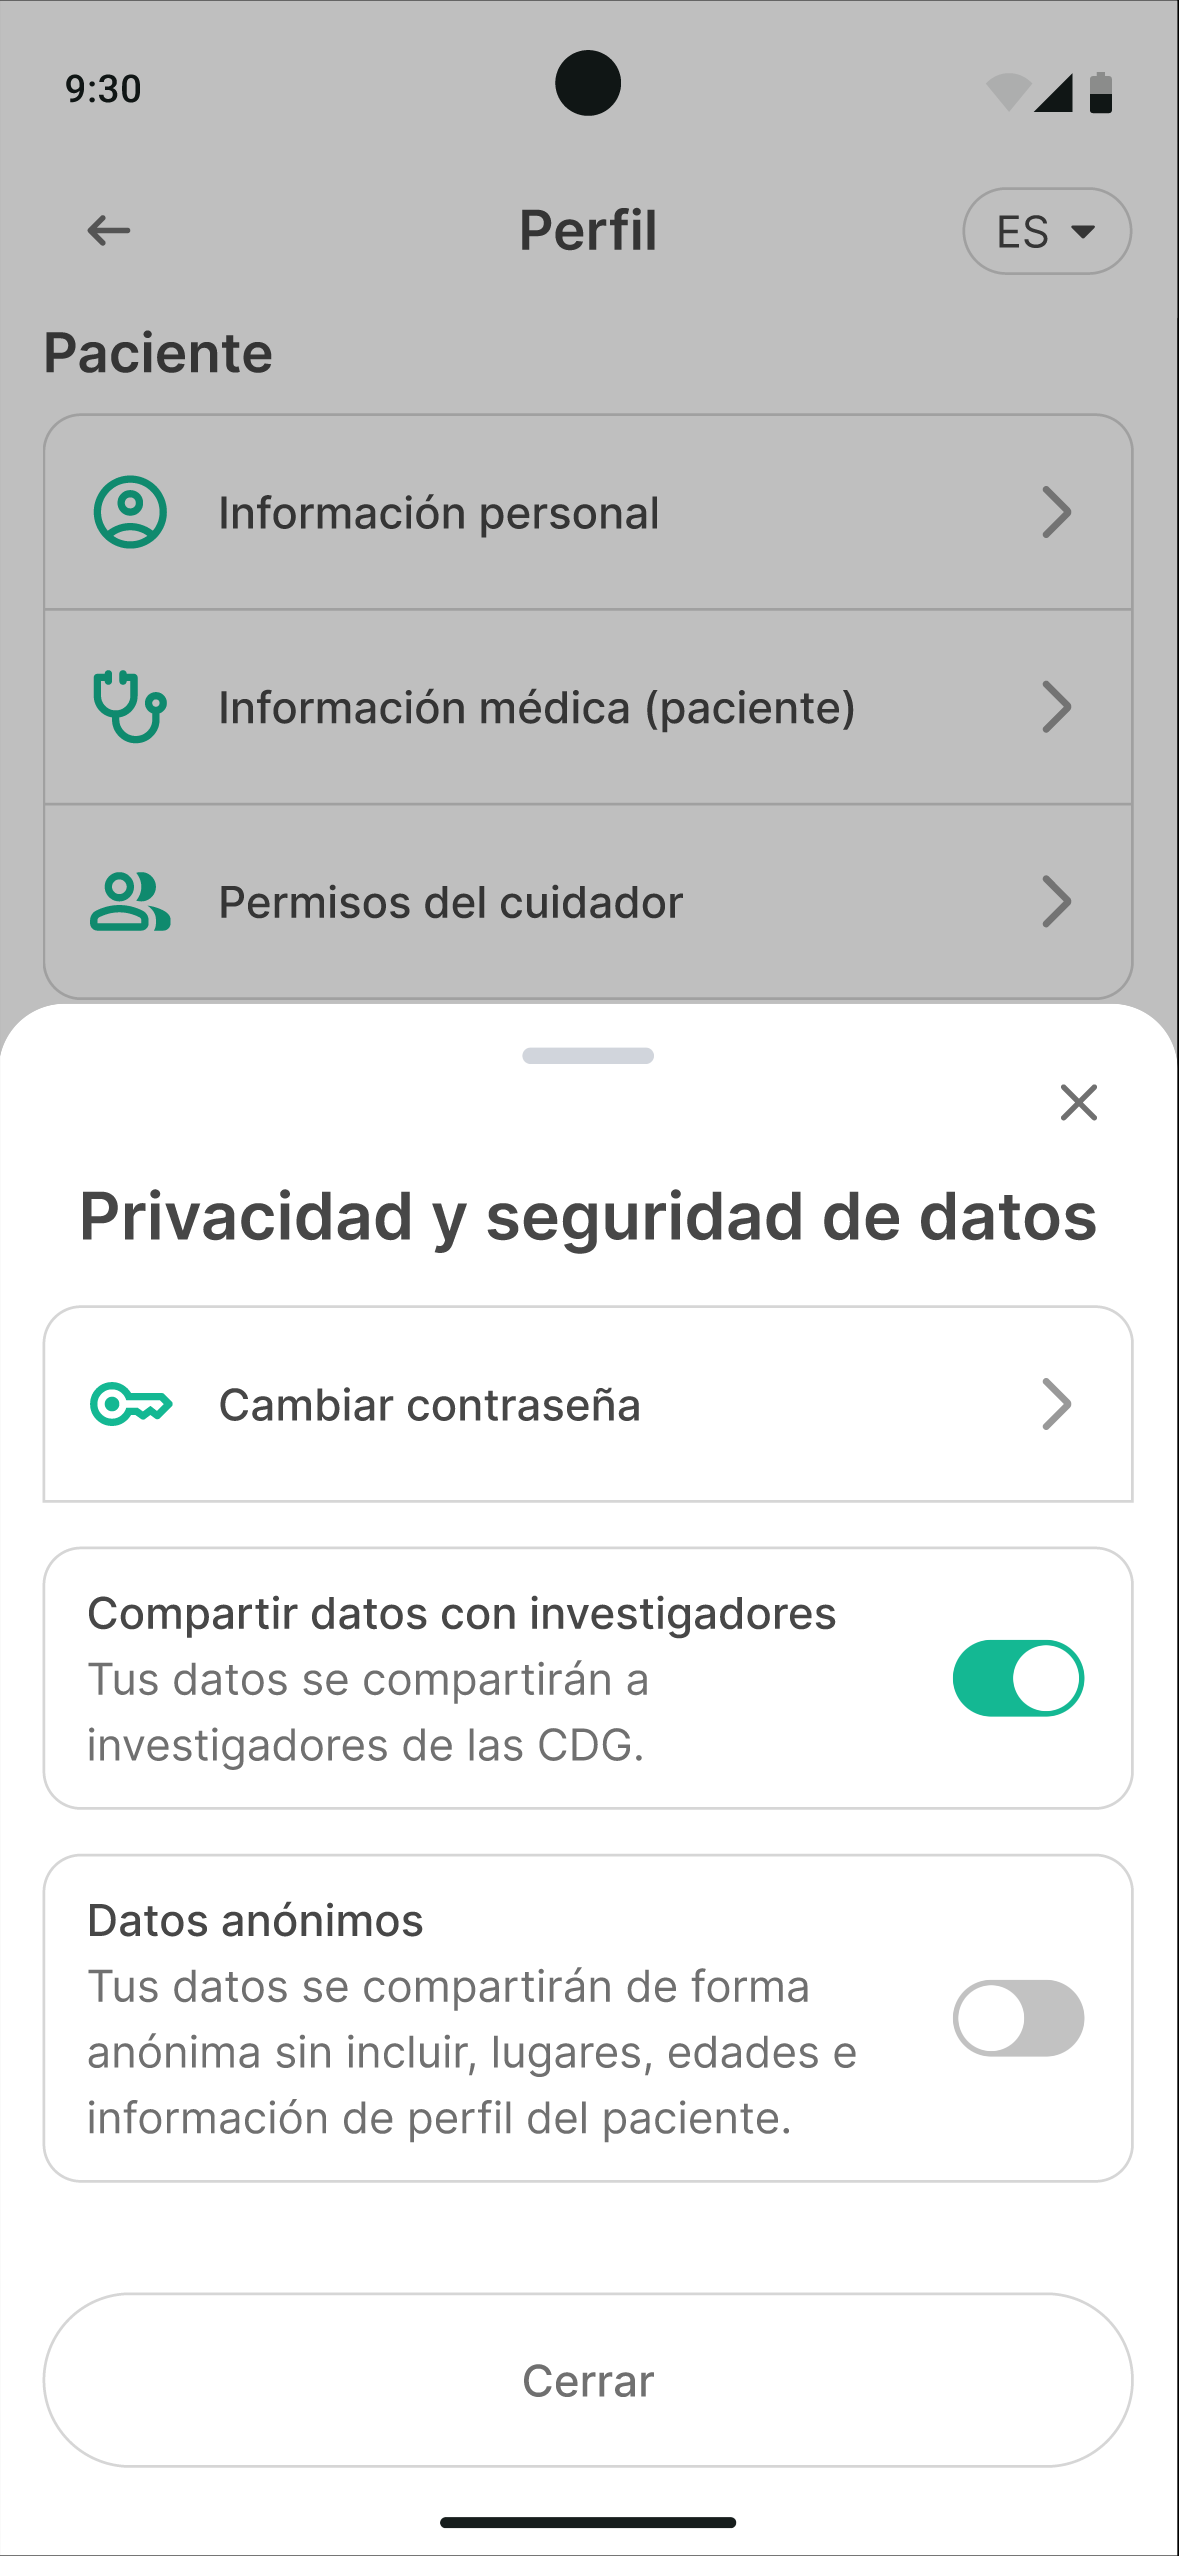
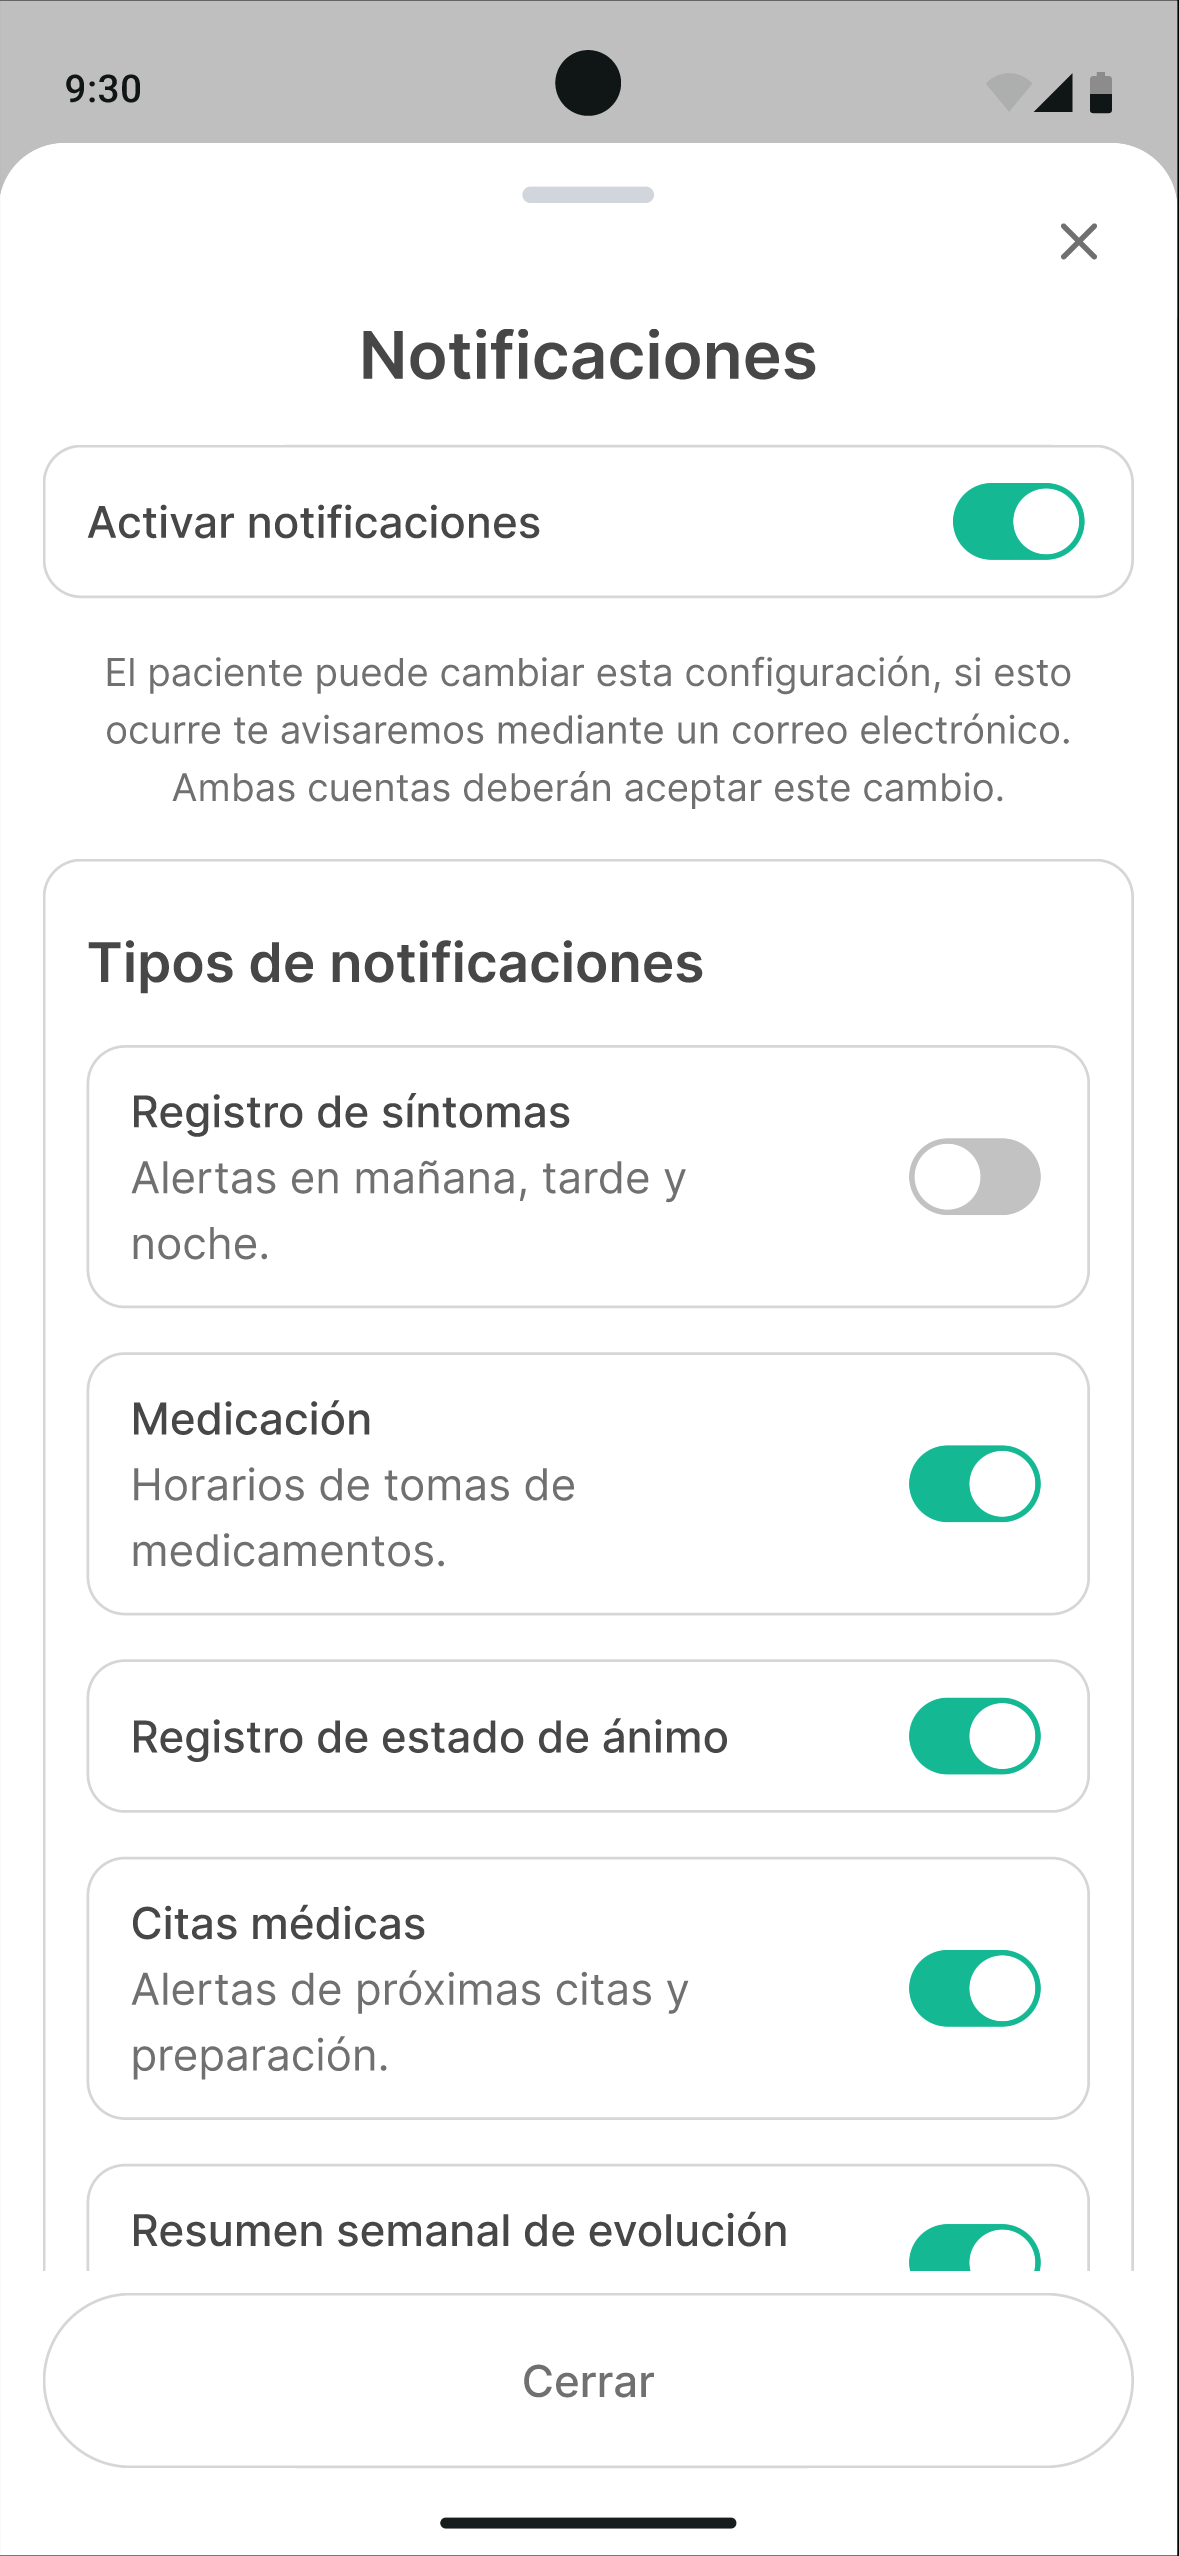
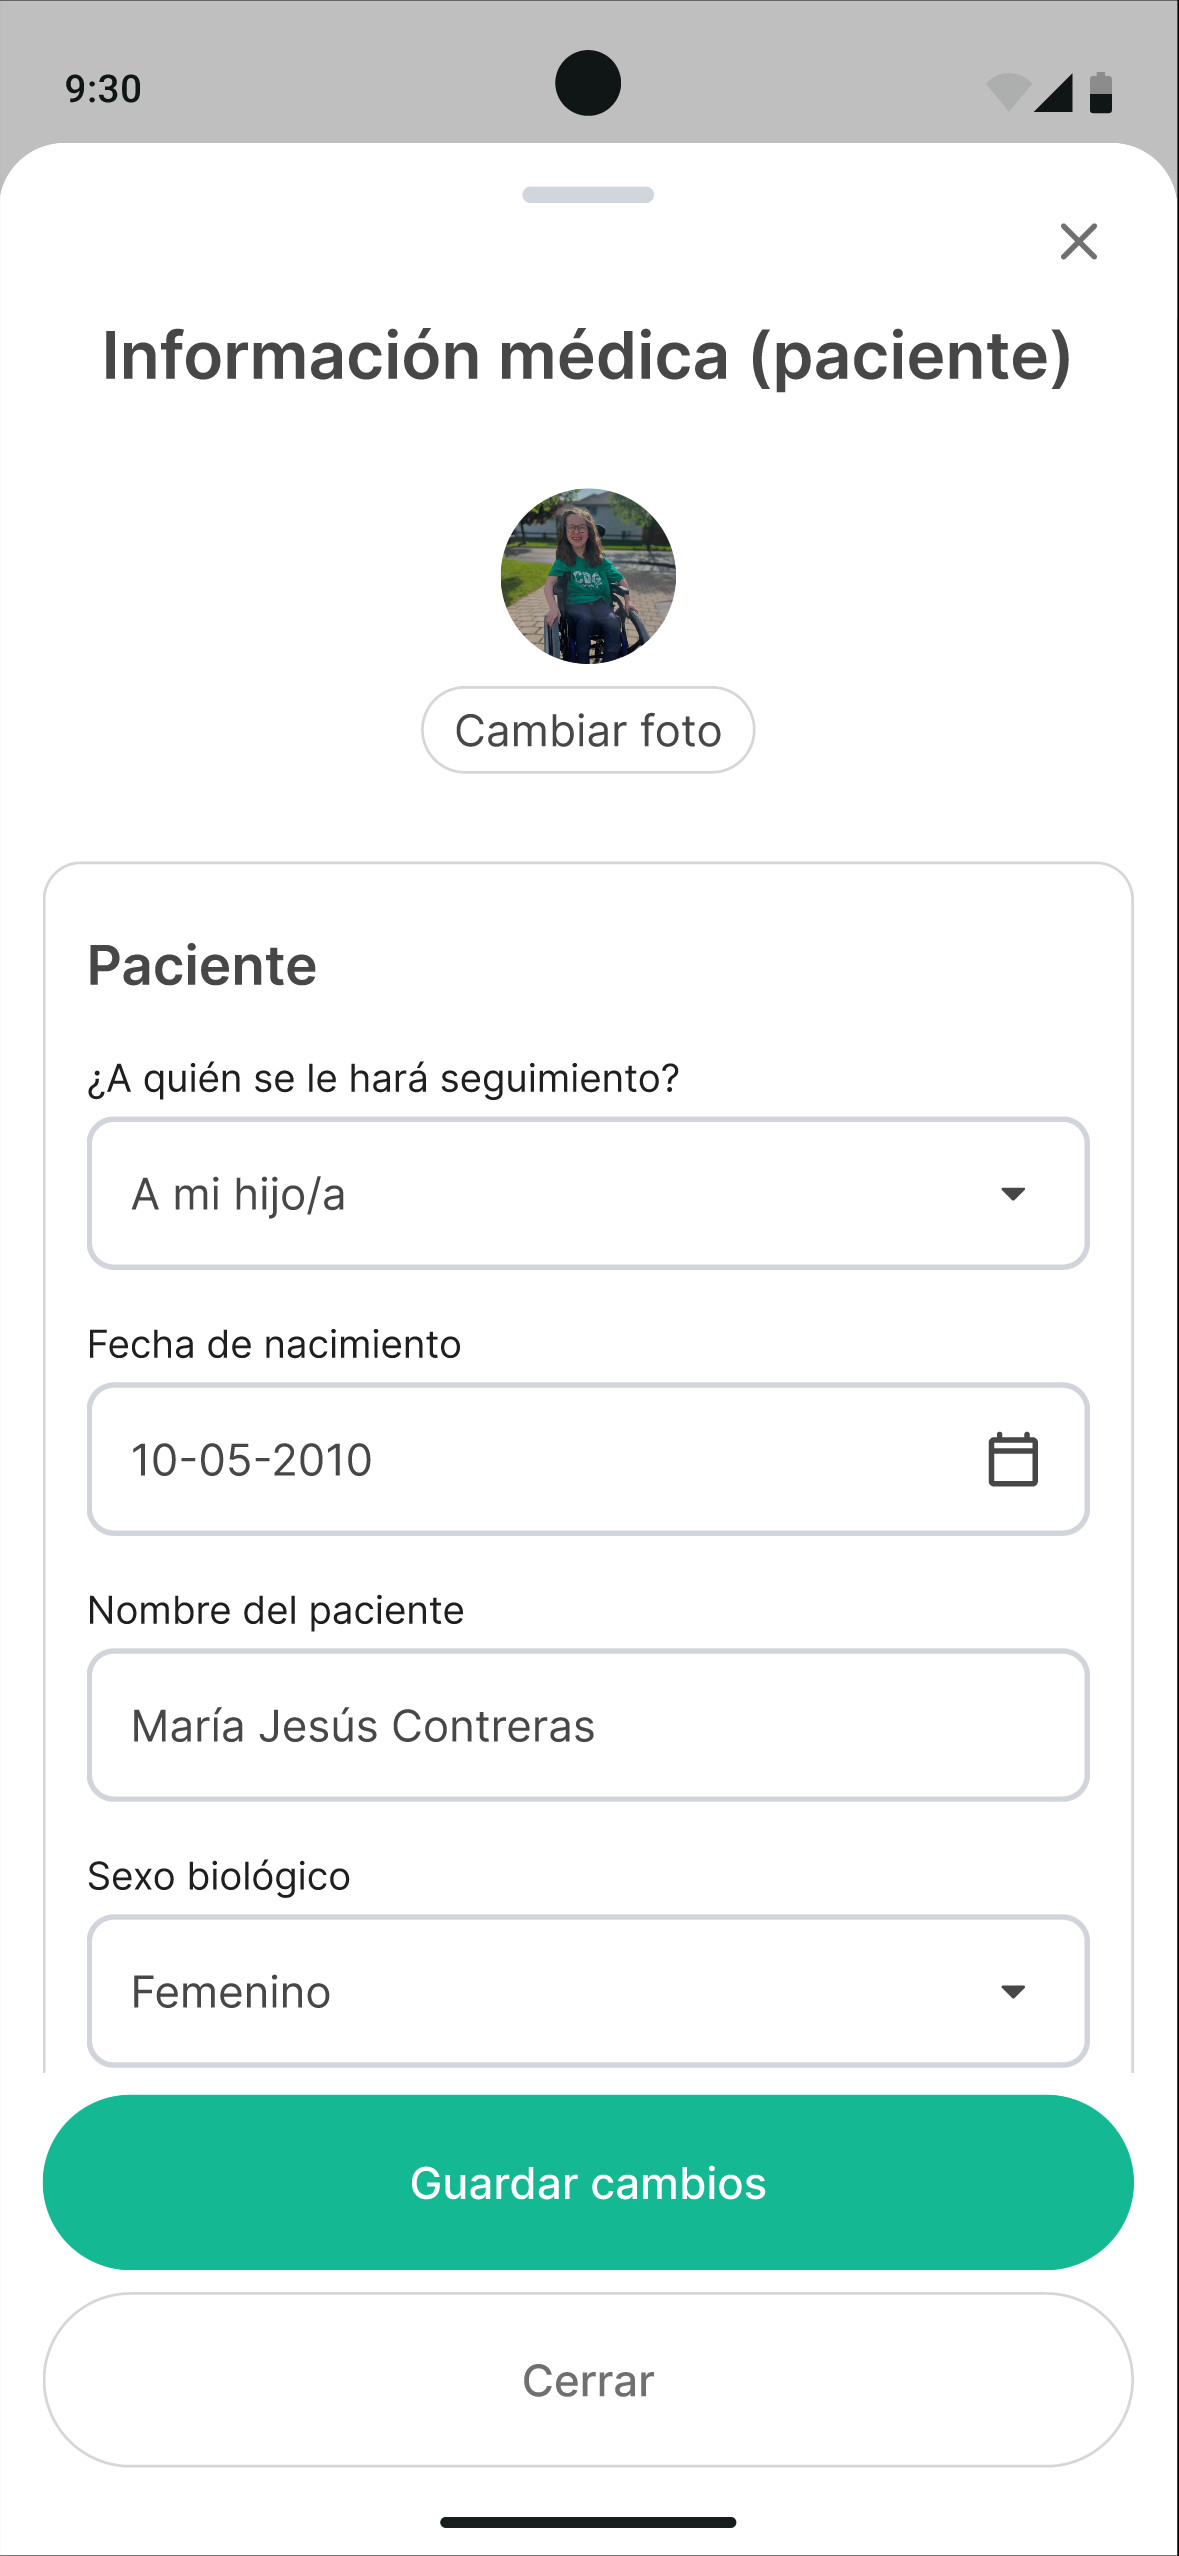
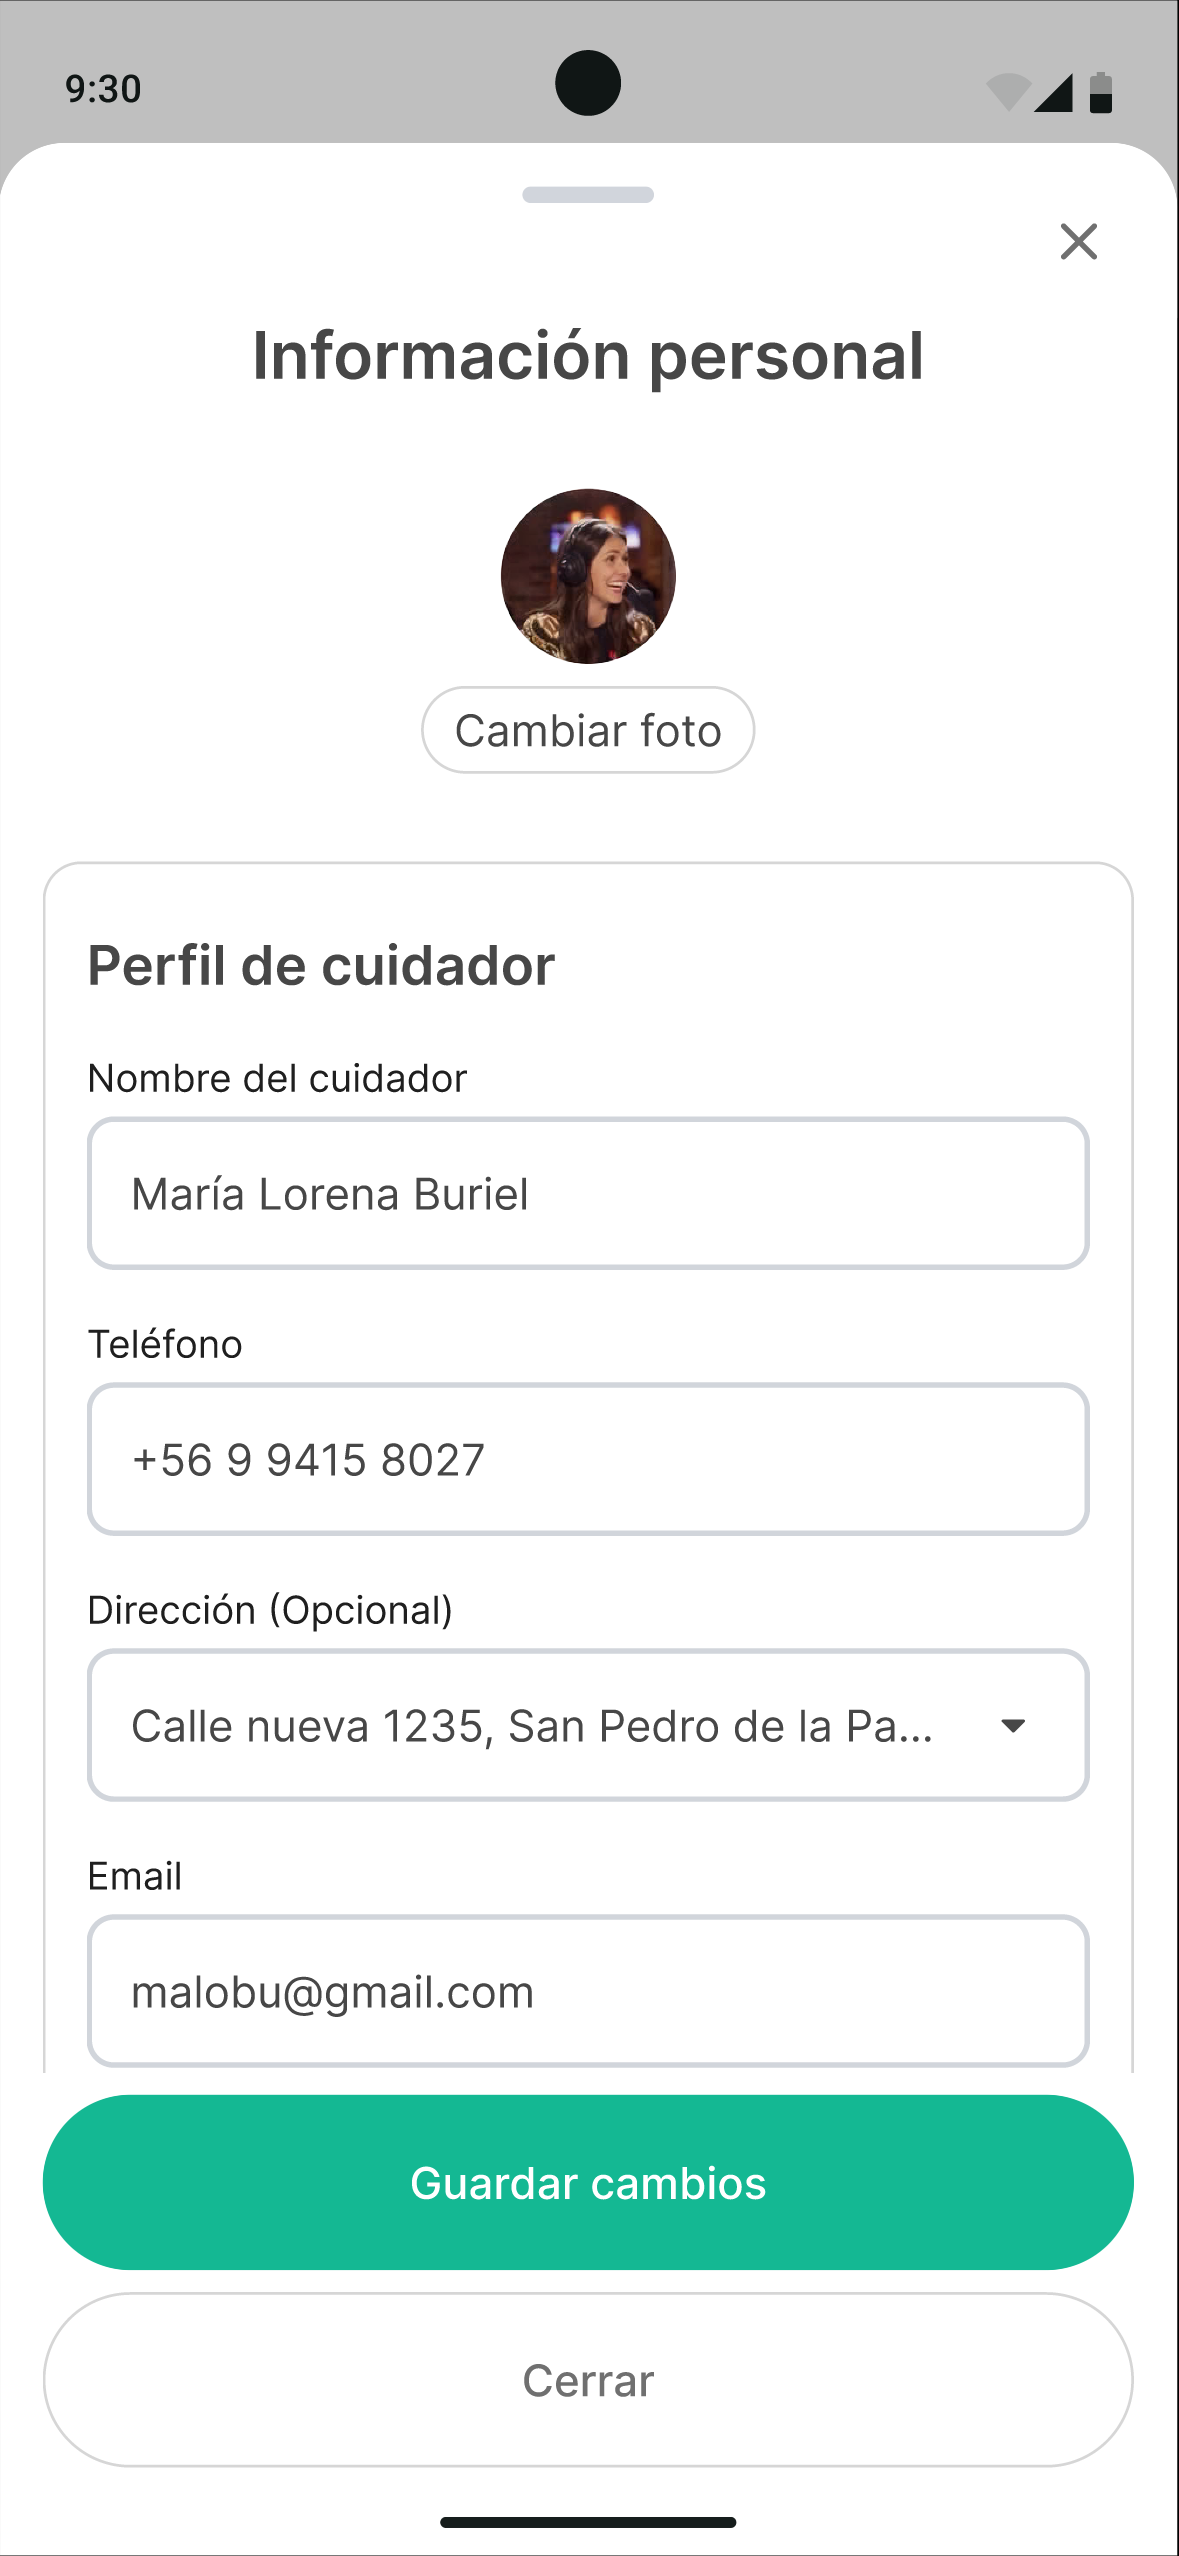
It wasn’t complete, it wasn’t perfect, but it did deliver the ability to present a product vision and get the feedback we needed so badly. At this point the community section and the user profile hadn’t been built yet.

What was presented:

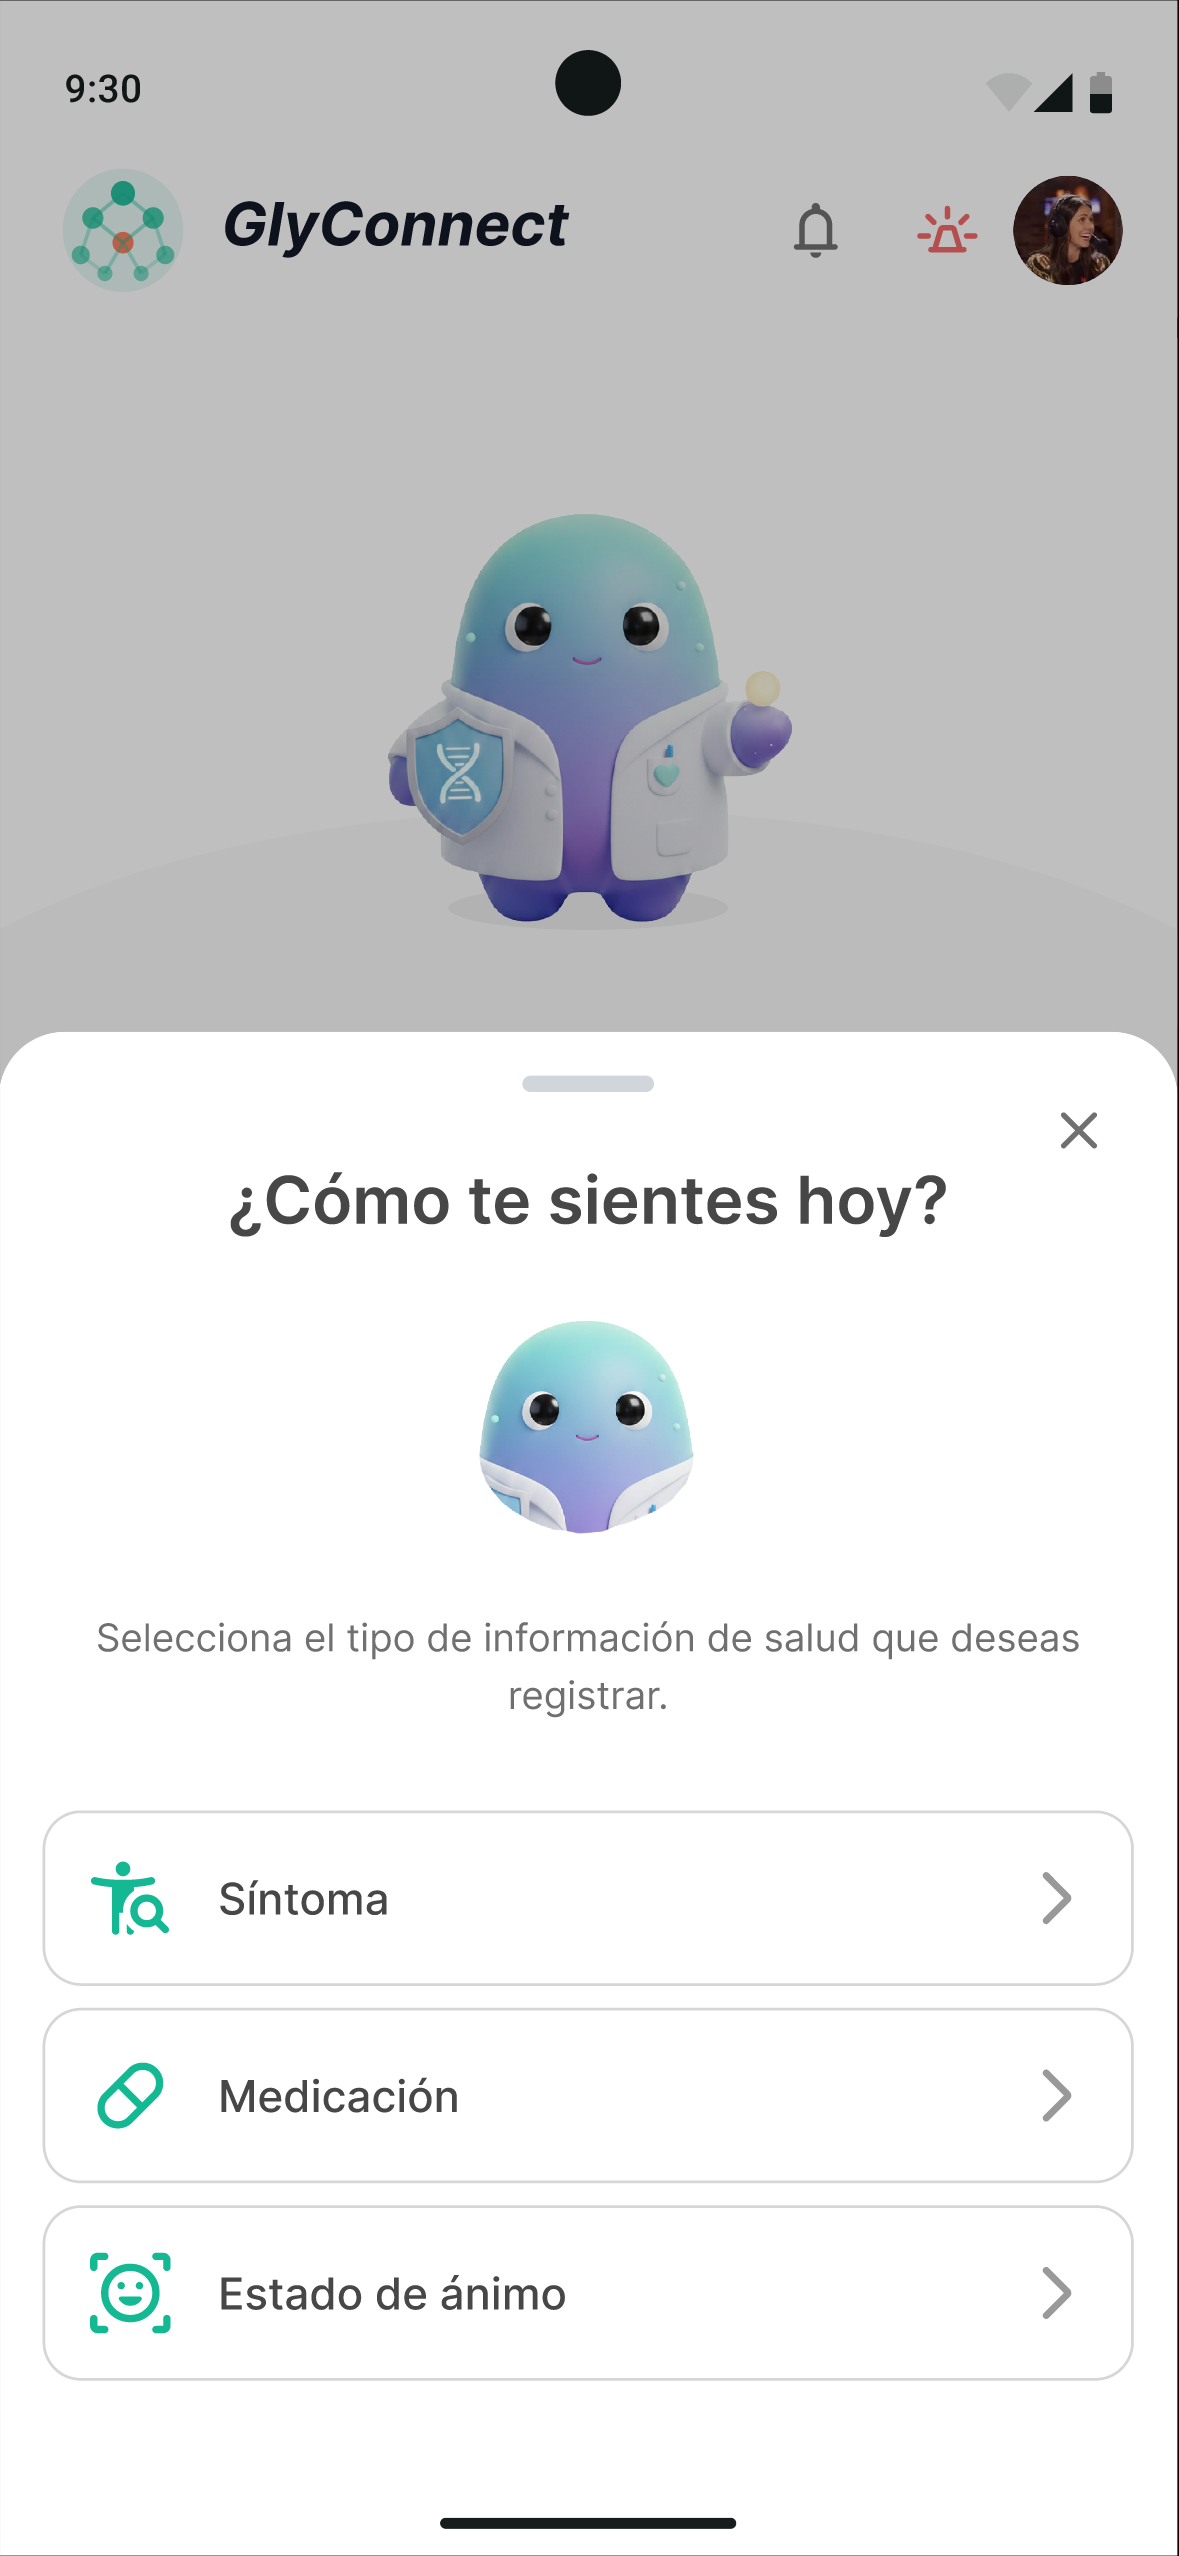
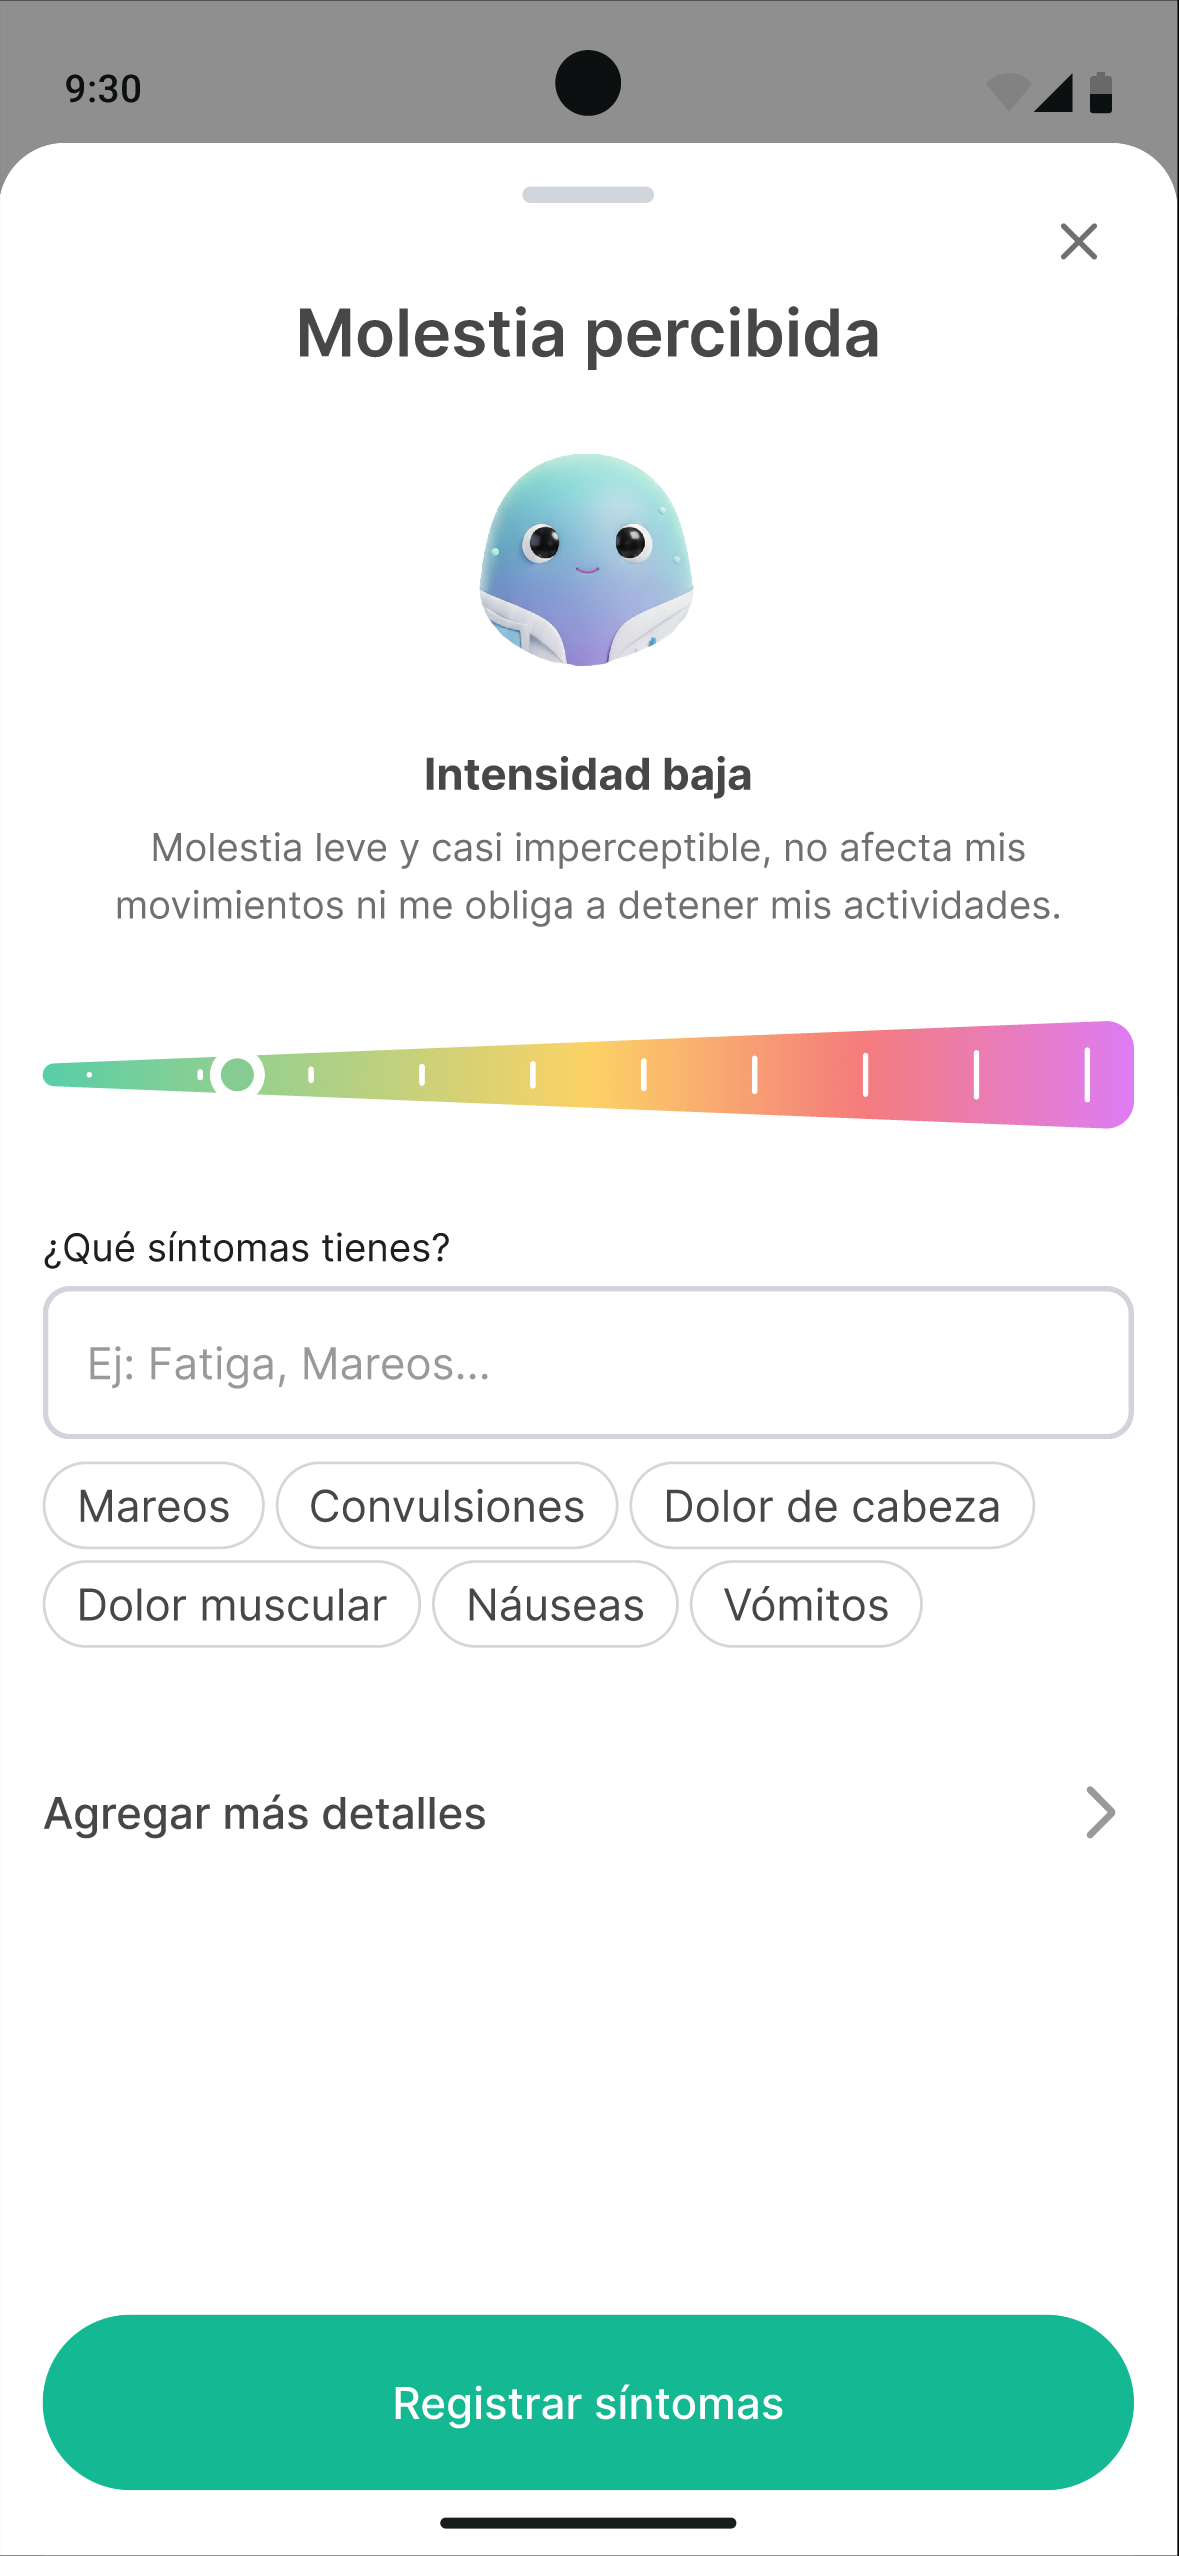
  • Symptom logging.
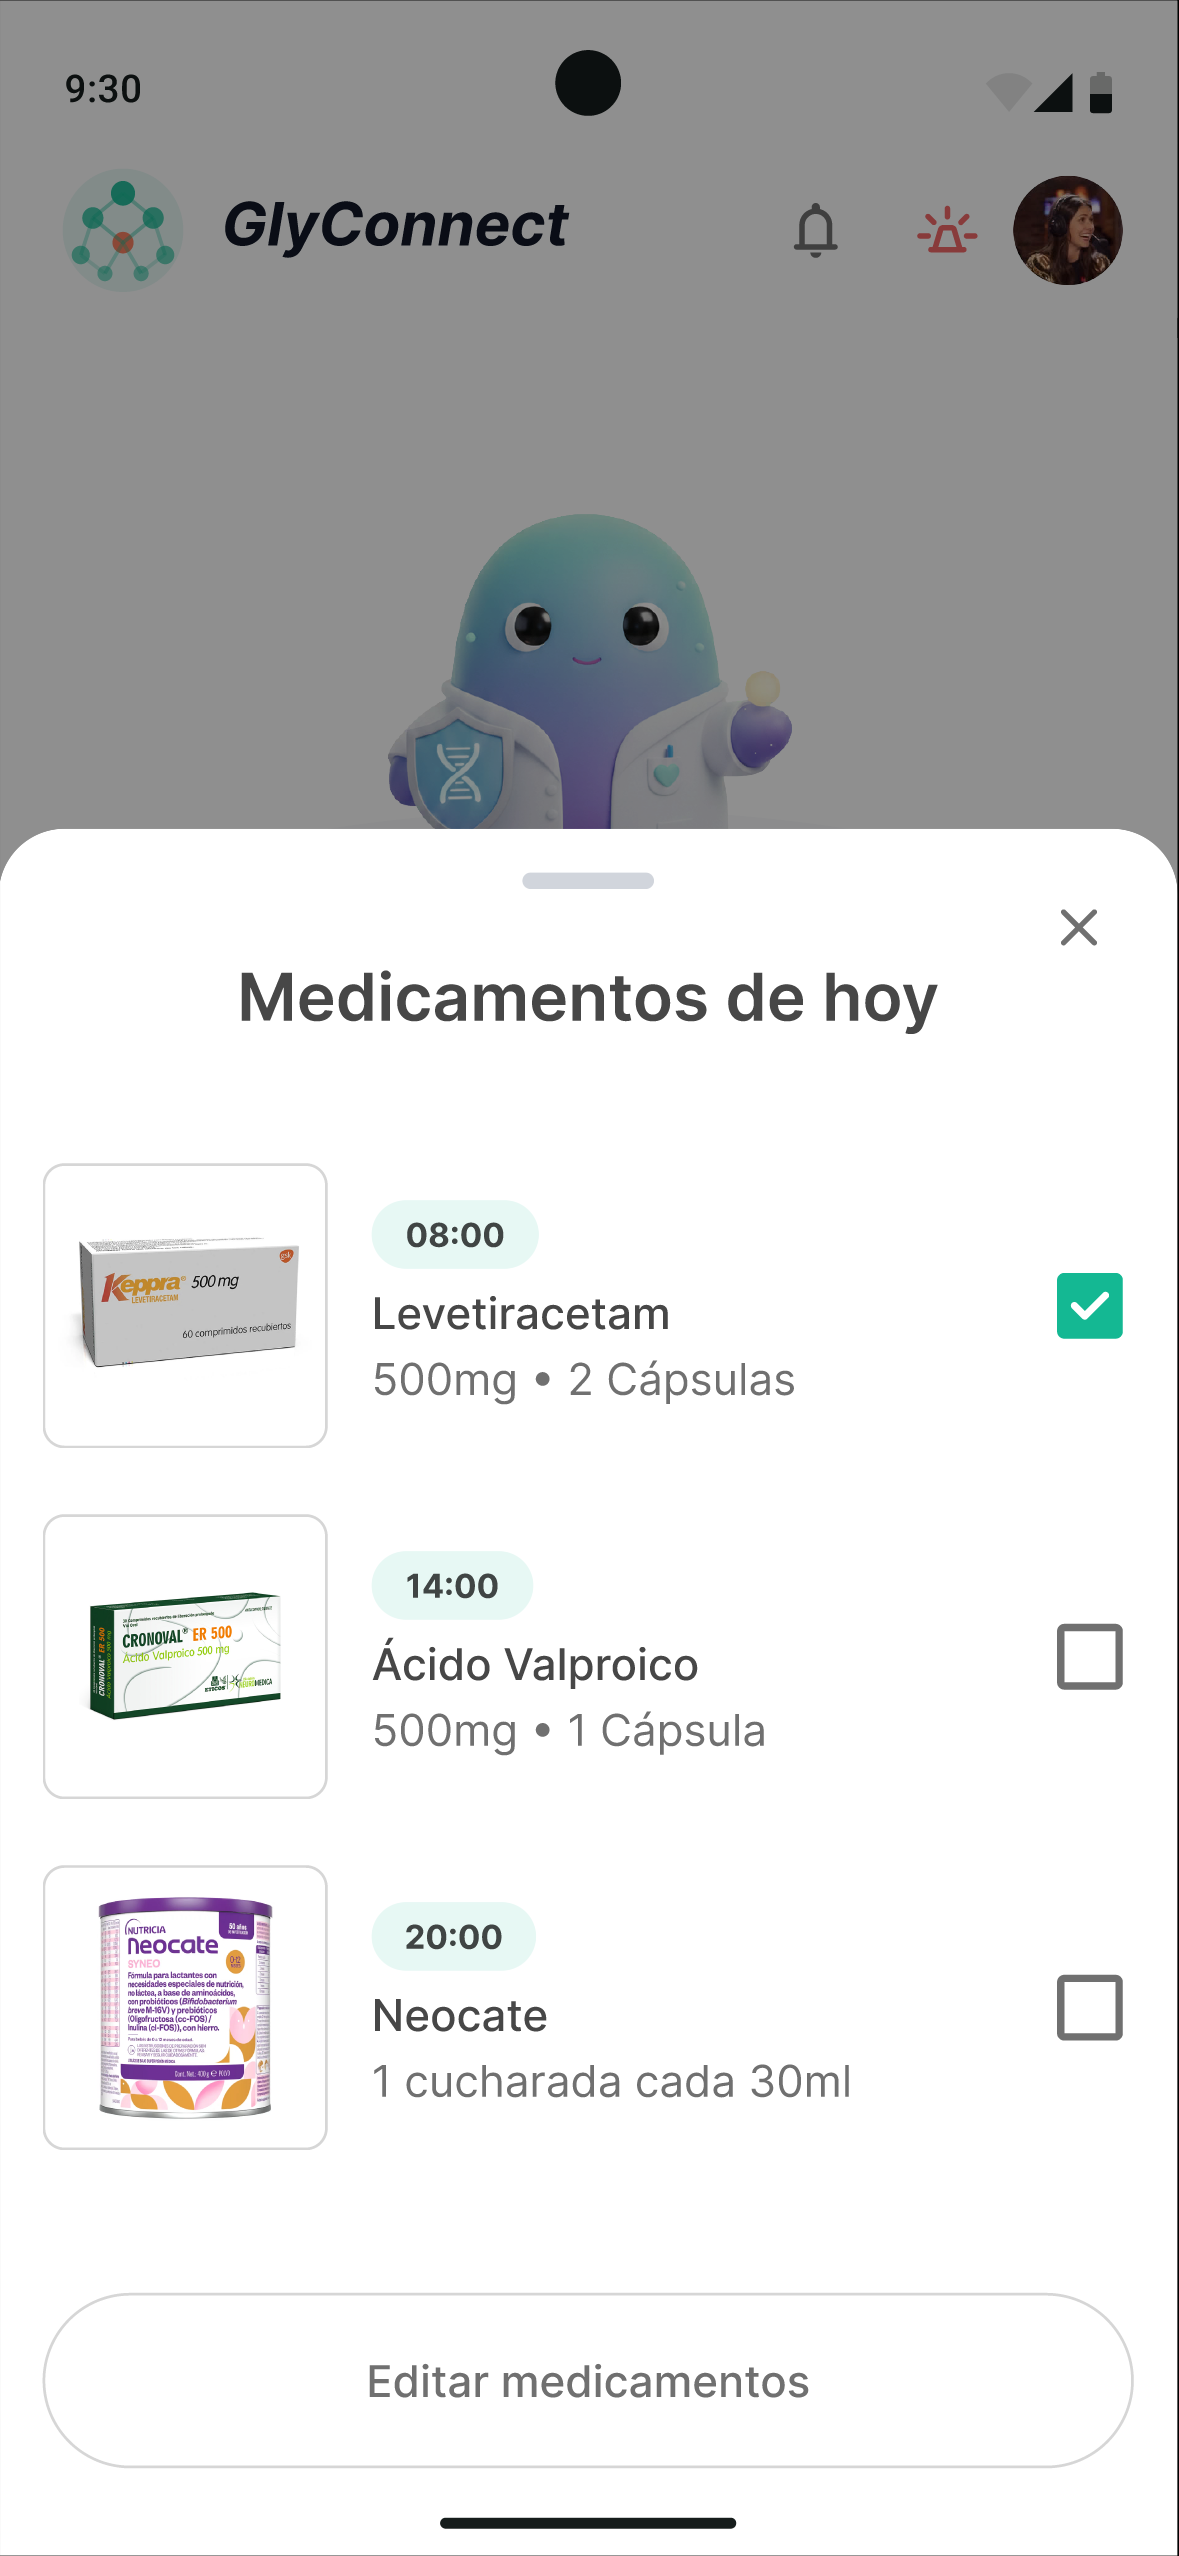
  • Medication logging and editing.
  • The ability to view all records (symptom history, medications, mood).
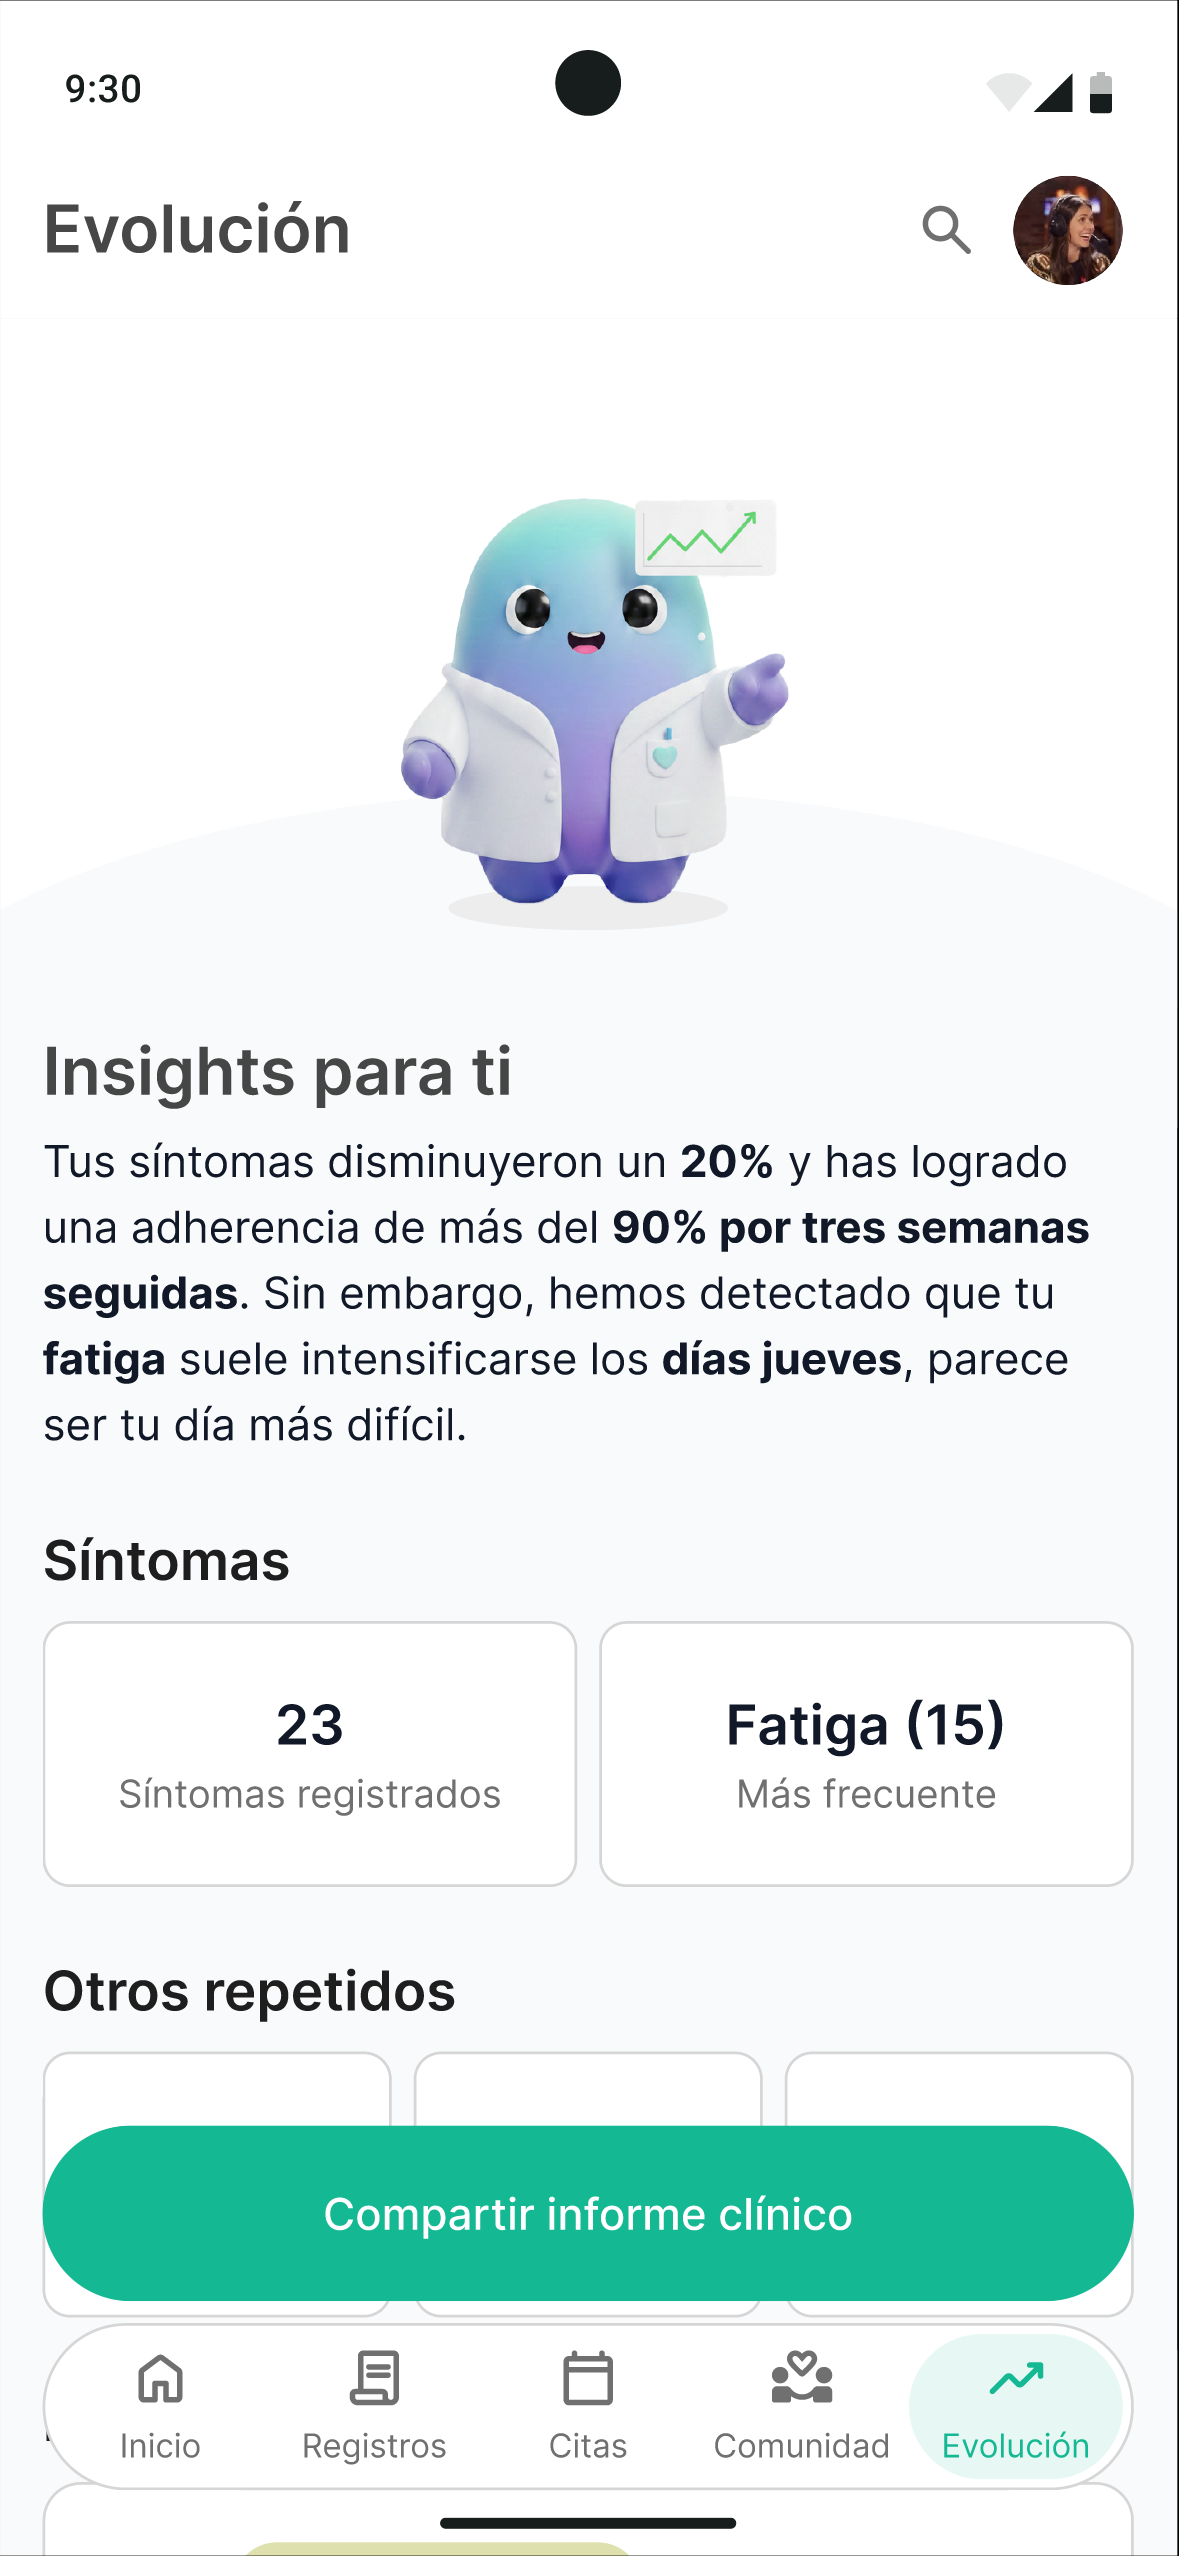
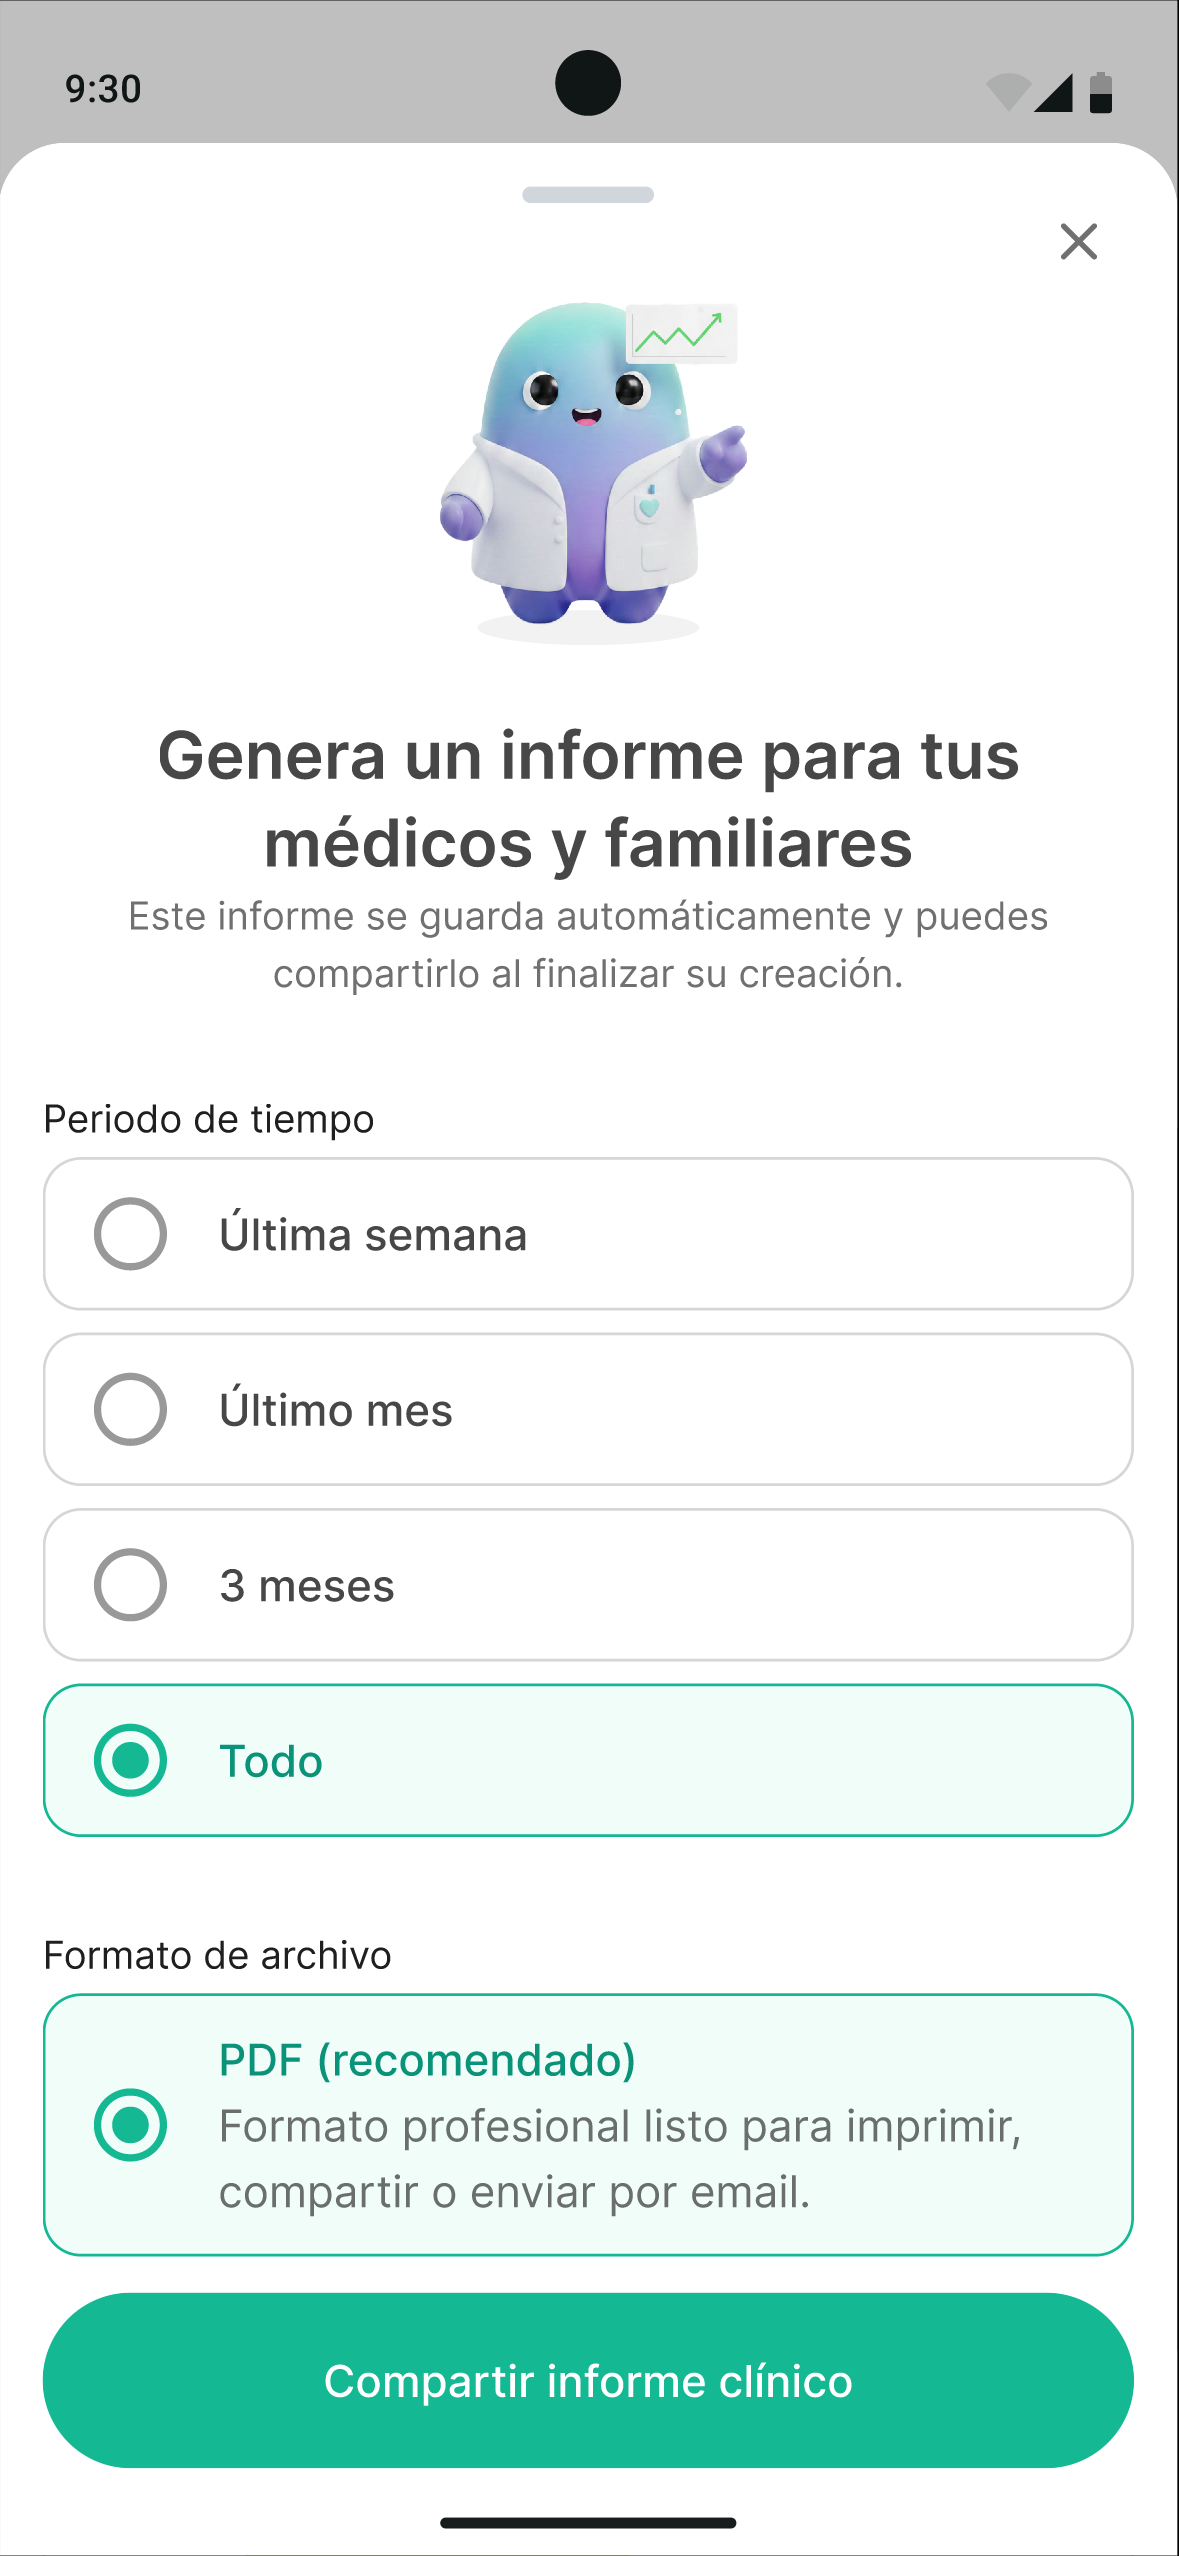
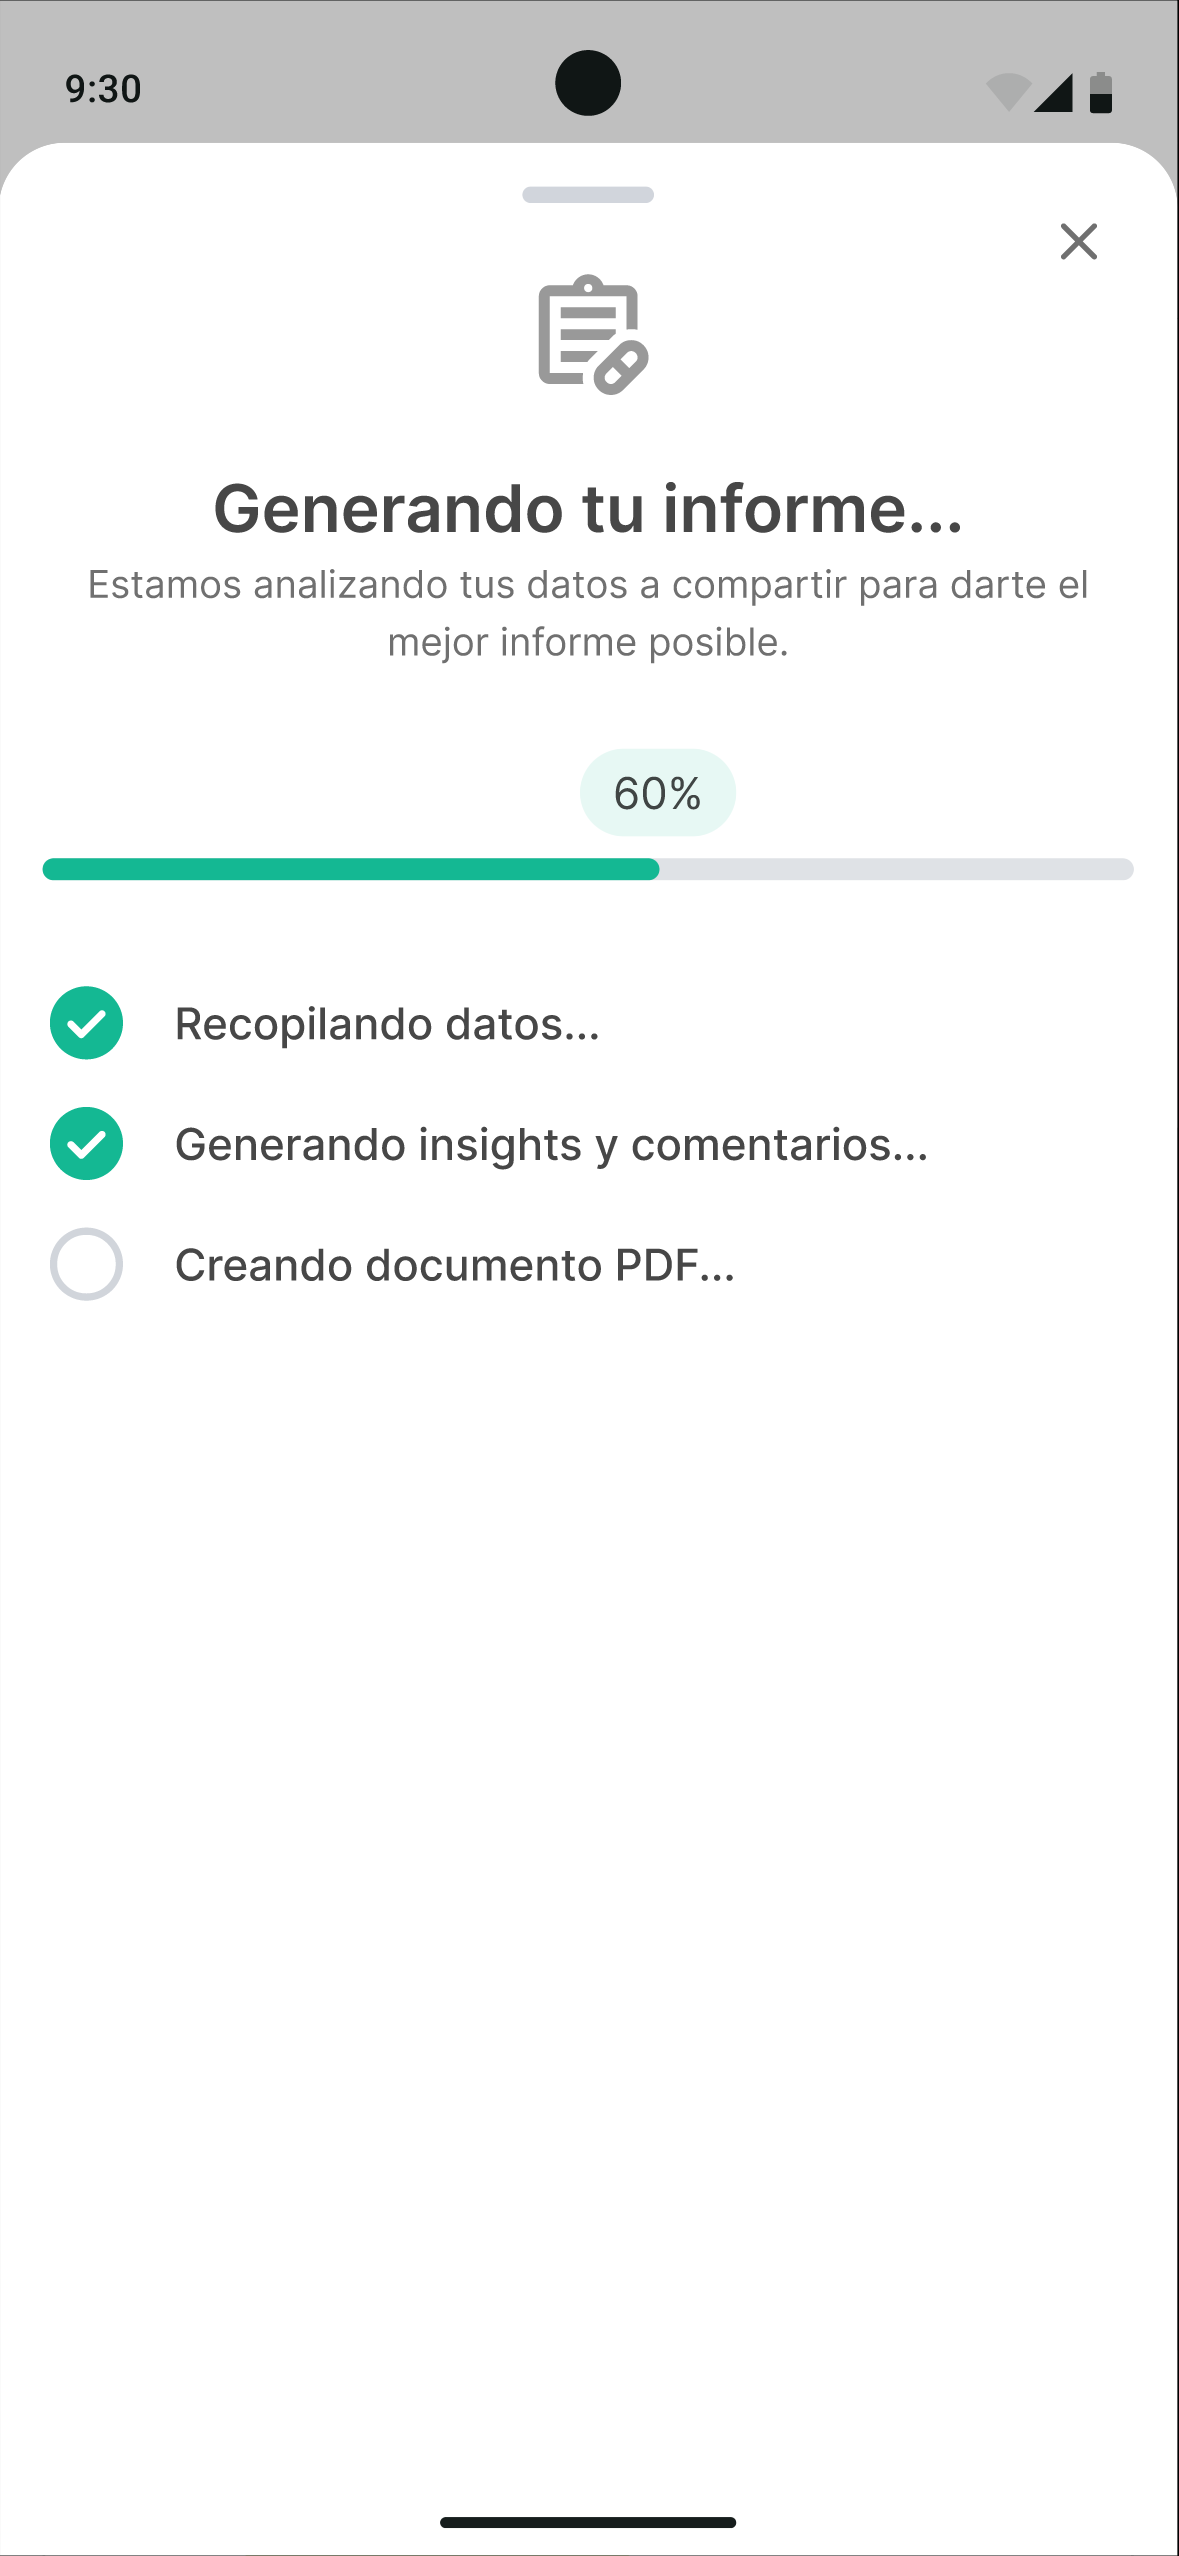
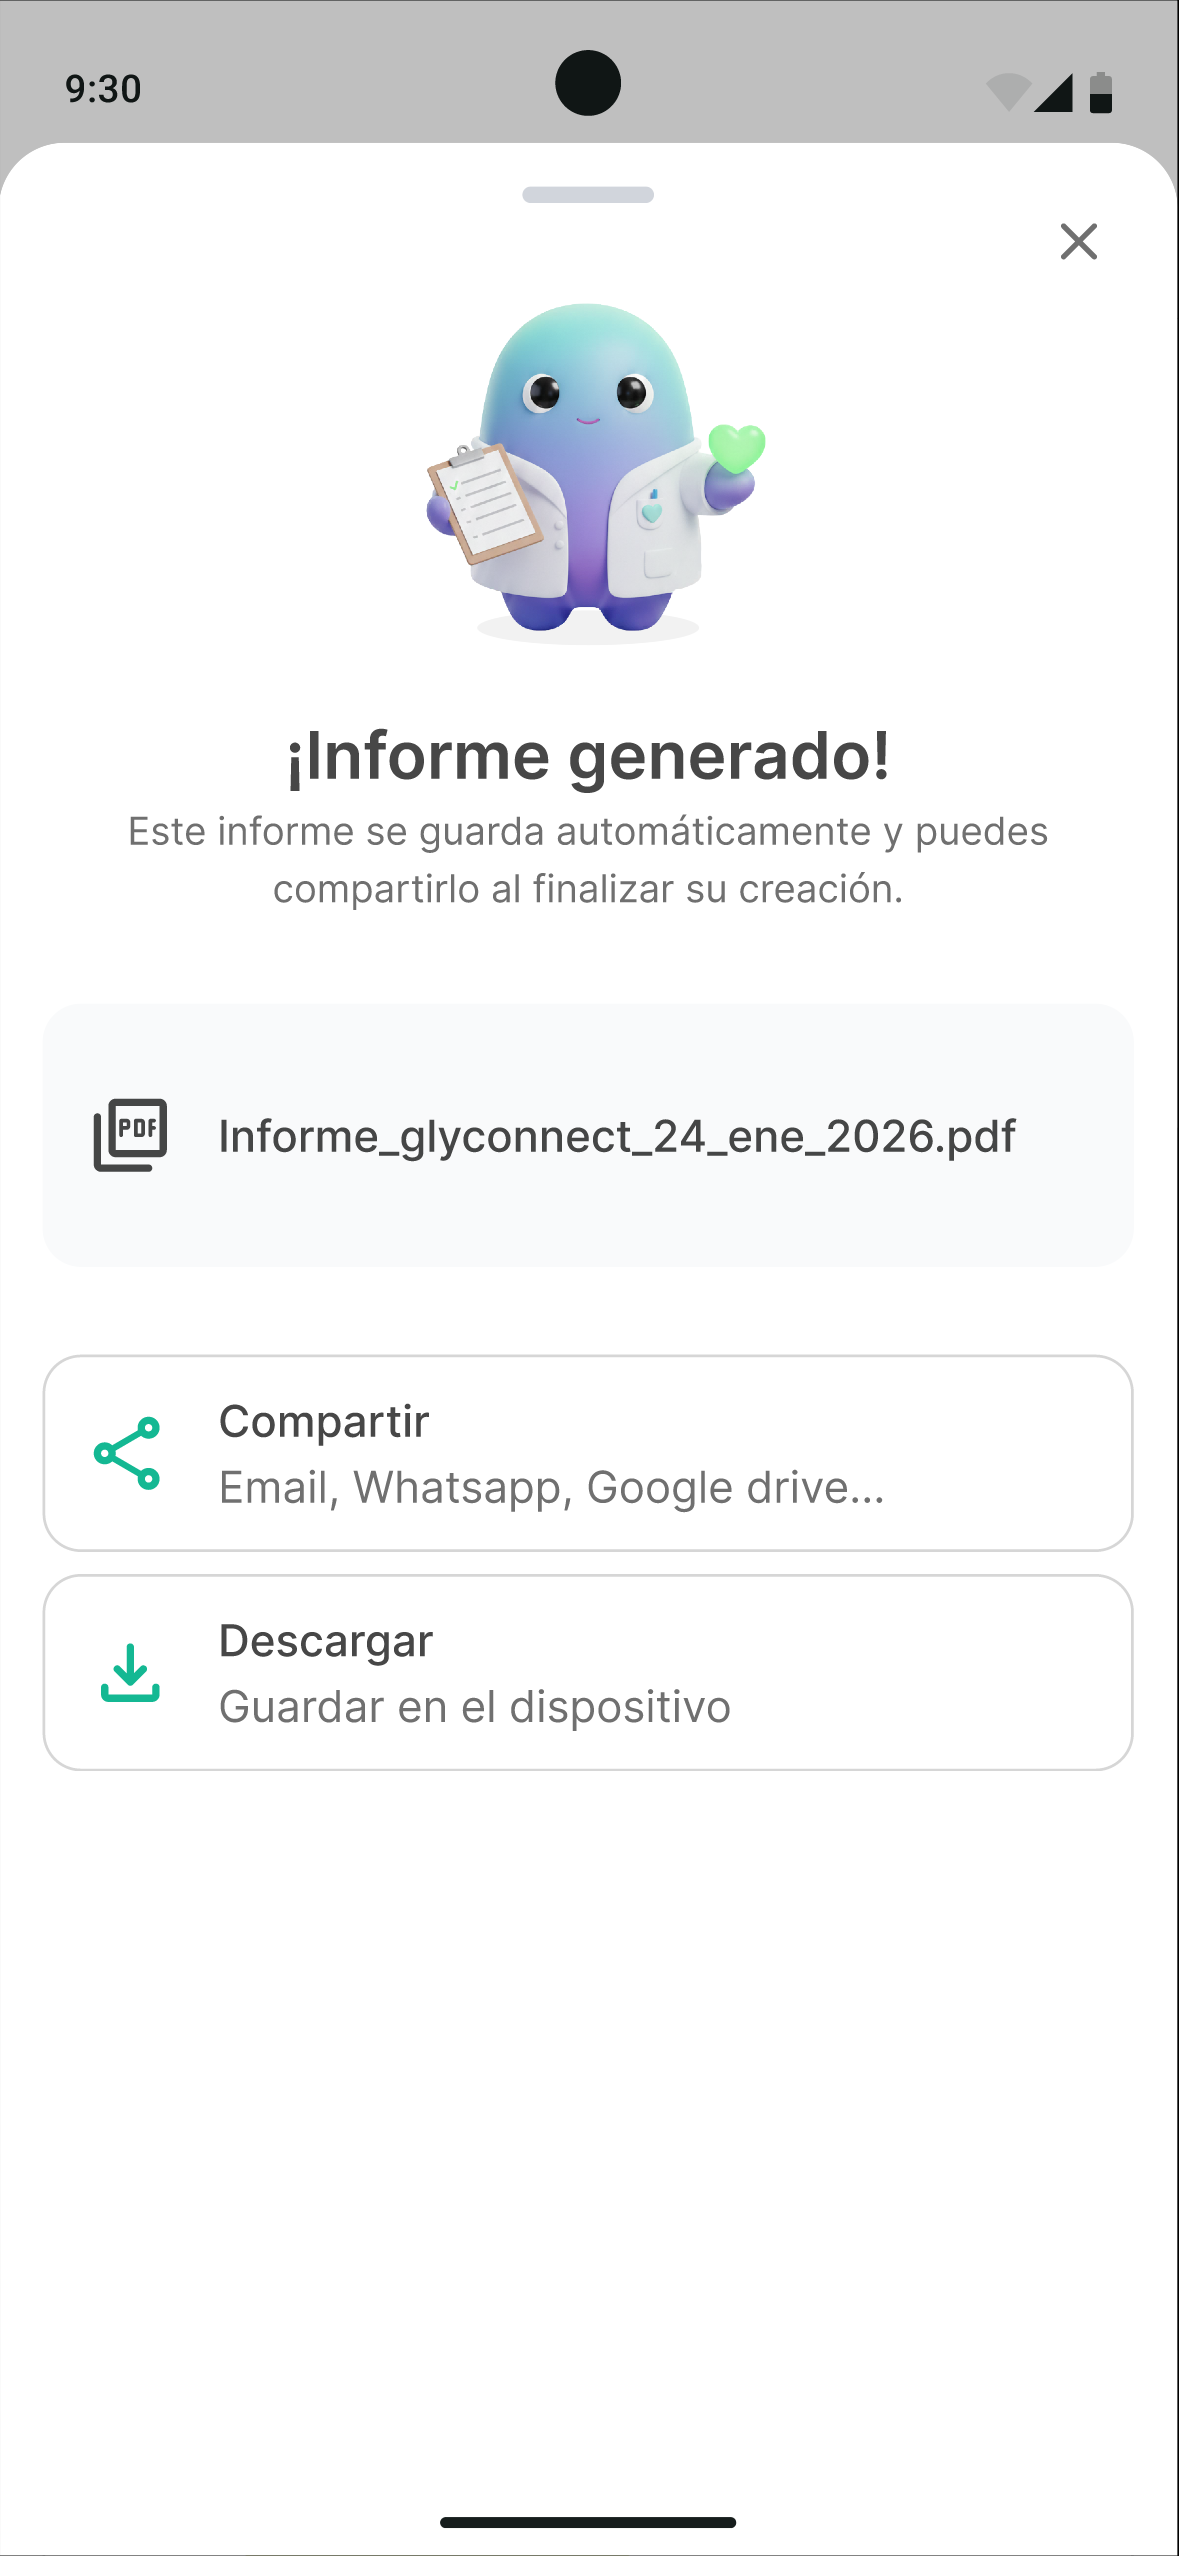
  • A progress section with the ability to generate and share a personalized medical report.

Validation with the CDG community

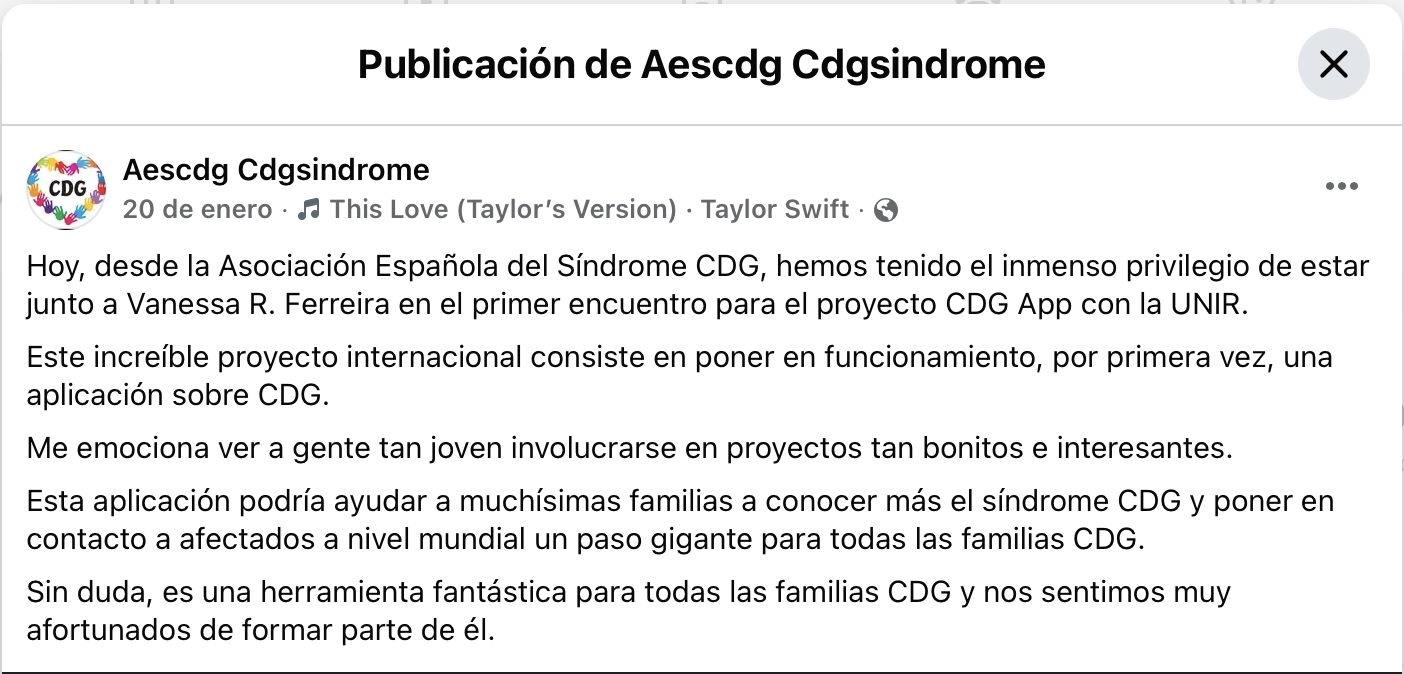
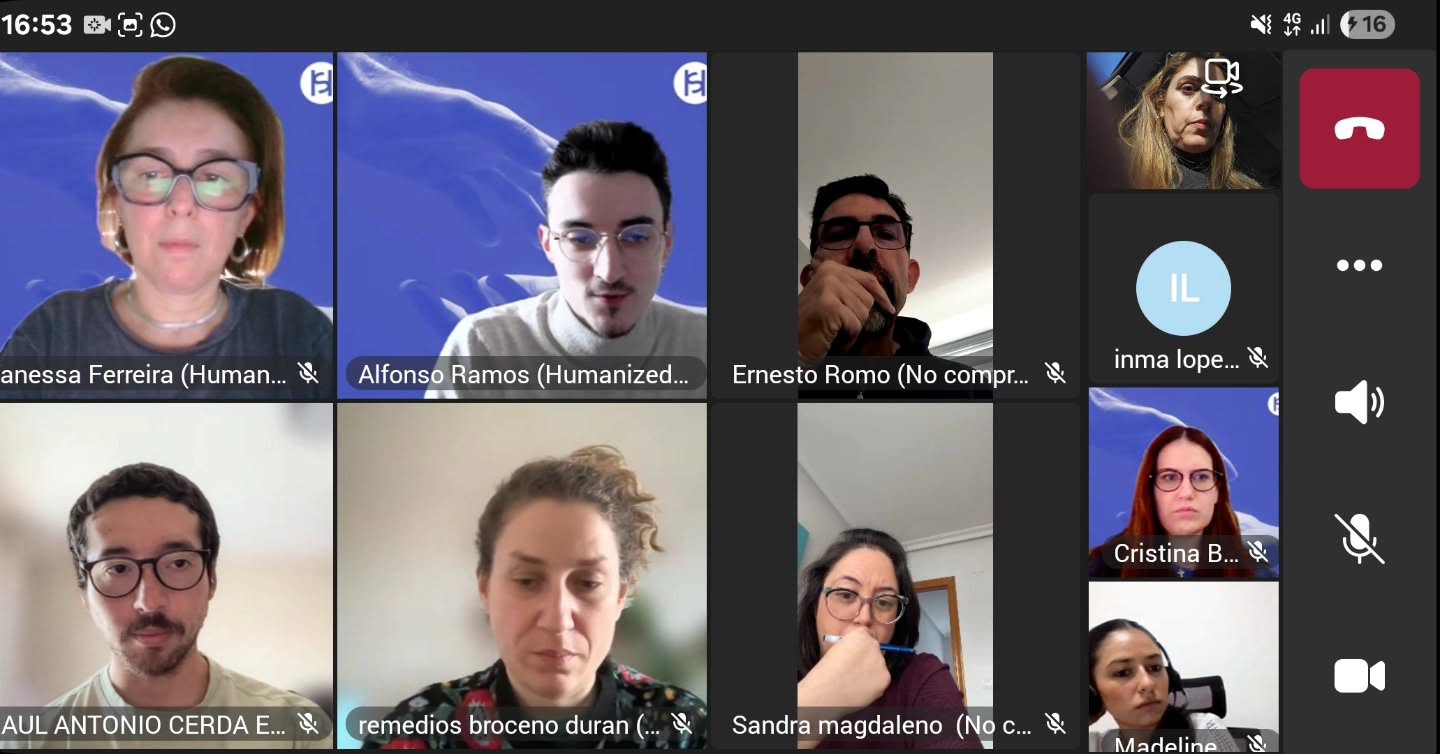
On January 20, 2026, we took the prototype to a focus group with active members of Spain’s CDG community, including patients, family members, and association representatives (Vanessa, Sergio, Cristina, Ernesto, and Sandra). The goal was to validate the project’s direction with end users.

After the demo, a consensus emerged that helped us redefine the project’s priorities. While the value of personal tracking was recognized, the community expressed a far more urgent need.
 

  • Medical emergencies (critical priority)
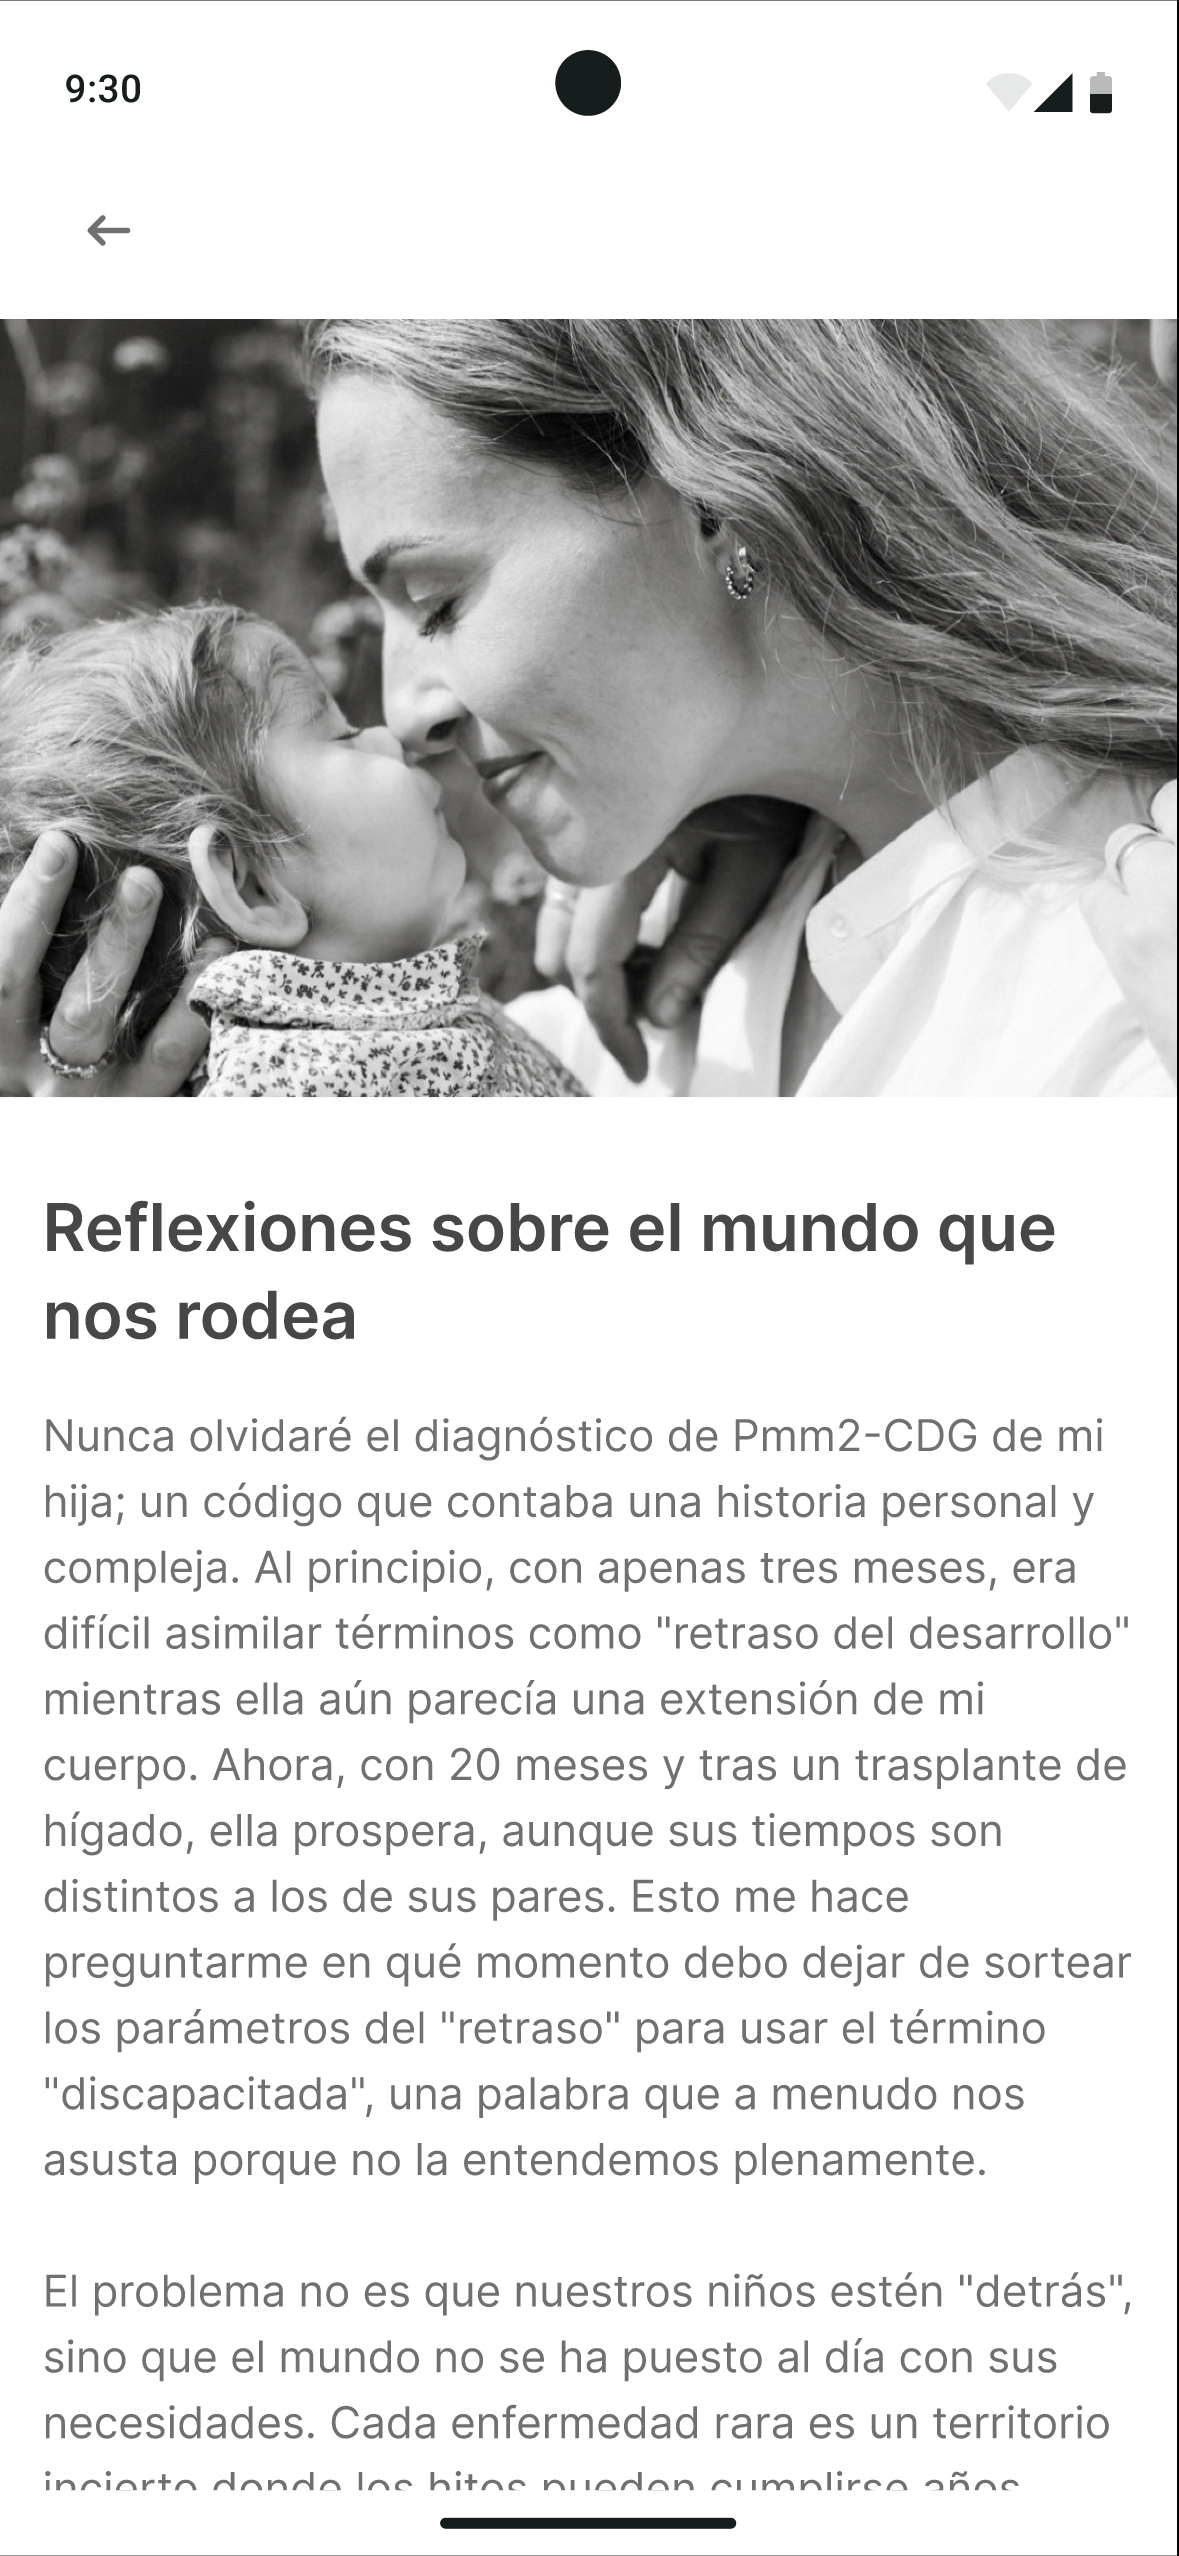
    The biggest concern is stroke-like episodes and how hard it is for non-specialized emergency services to apply the correct protocols.
  • Informational content (high priority)
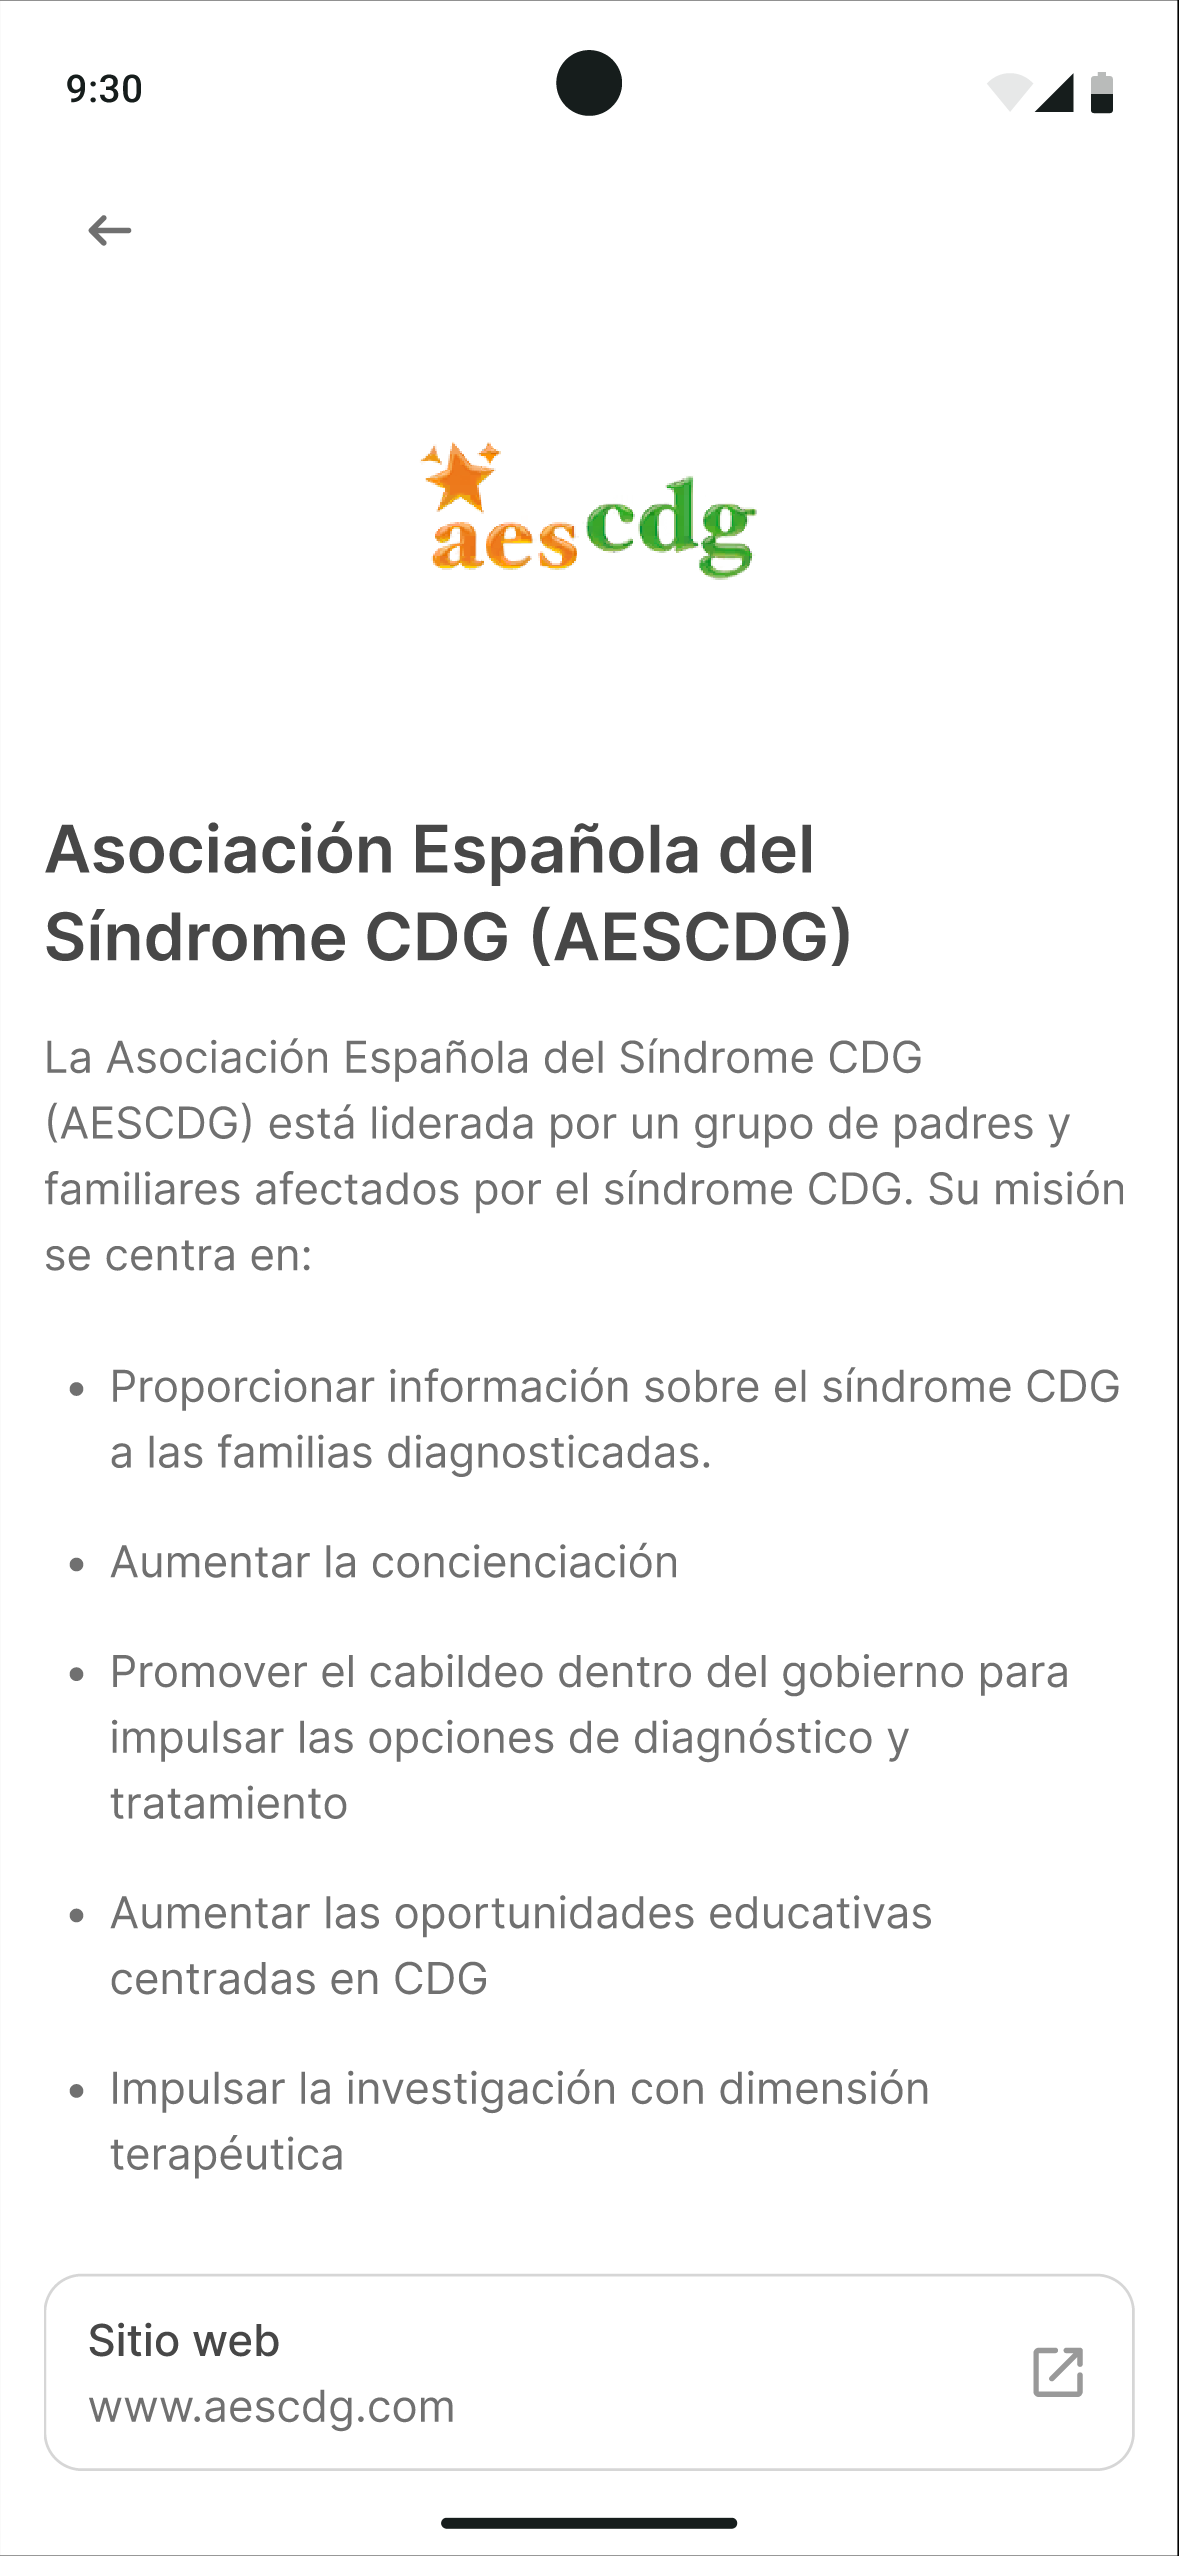
    They need a validated central repository with metabolic guidance, protocols, reference hospitals and doctors, researchers, and associations.
  • Practical functionality (high priority)
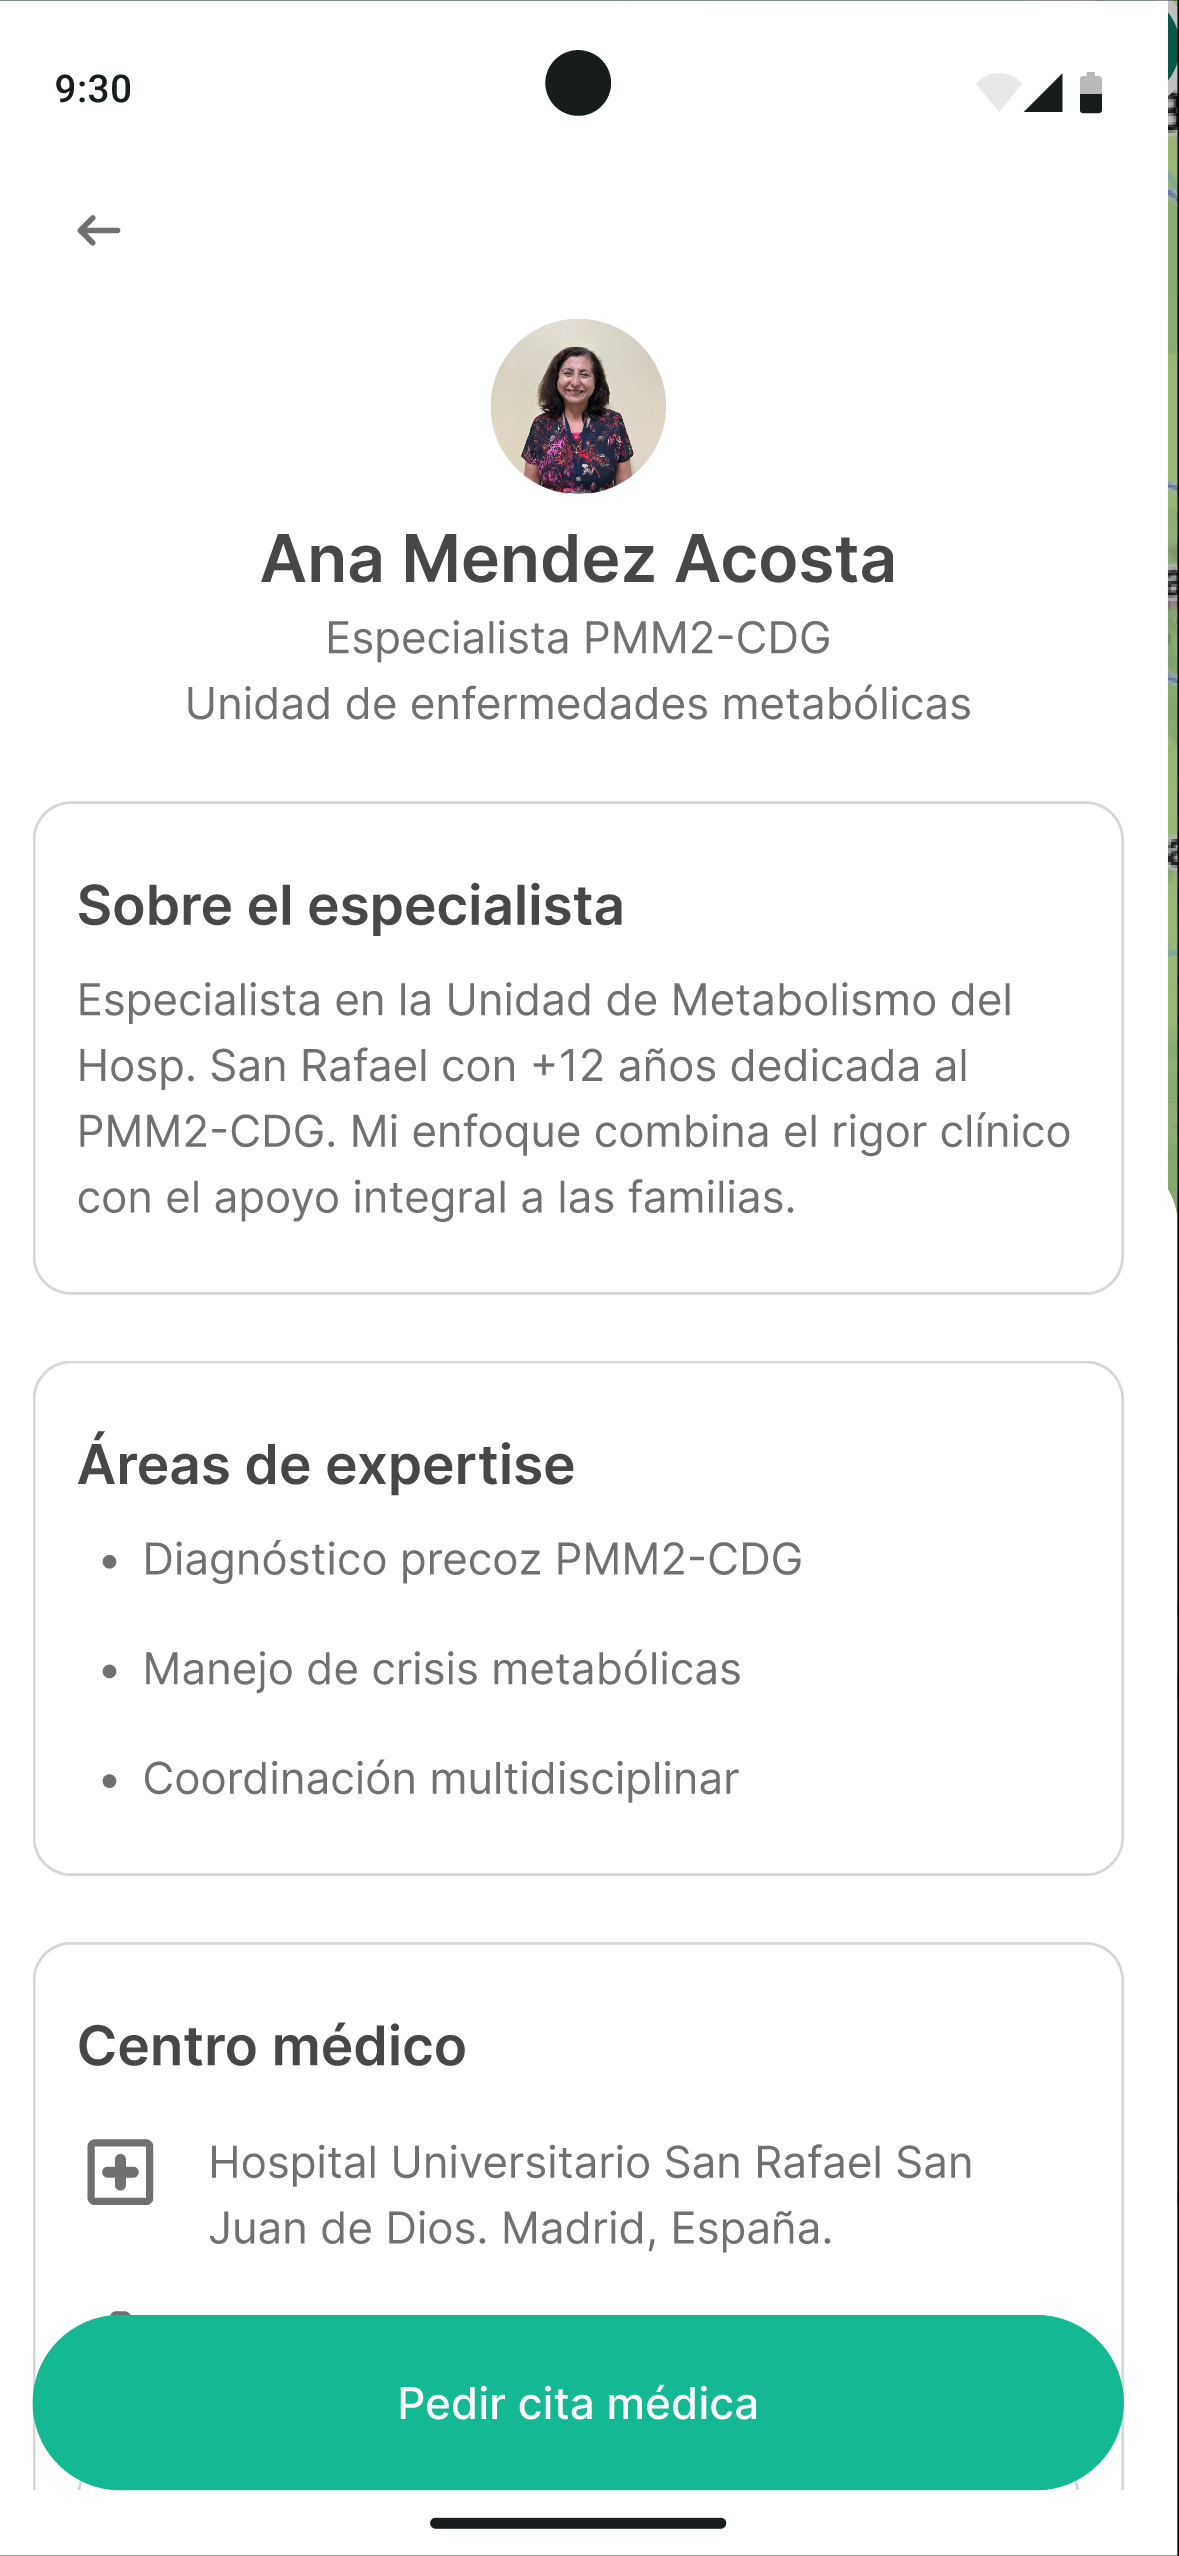
    Finding the nearest reference hospital while traveling and having specialists’ contact info on hand.
  • Project focus
    One participant (Ernesto) suggested that an approach similar to a “CDG Wikipedia” could deliver more value than personal tracking.

We had the flexibility to pivot at an advanced stage. The priority shifted from a self-management tool to an empowerment-through-information platform, with a modular rollout, starting with the informational and emergency foundation.

This is partly because in Spain, medical follow-up is fairly well solved, with shared diagnostic and medical-history data for patients, something still in progress in Latin American countries — and we made clear that while Humanized Solutions is focused on Spain, this solution needs a global outlook, since gathering data is crucial for researchers, who often work in silos with no awareness of small advances happening elsewhere in the world.

Final iteration

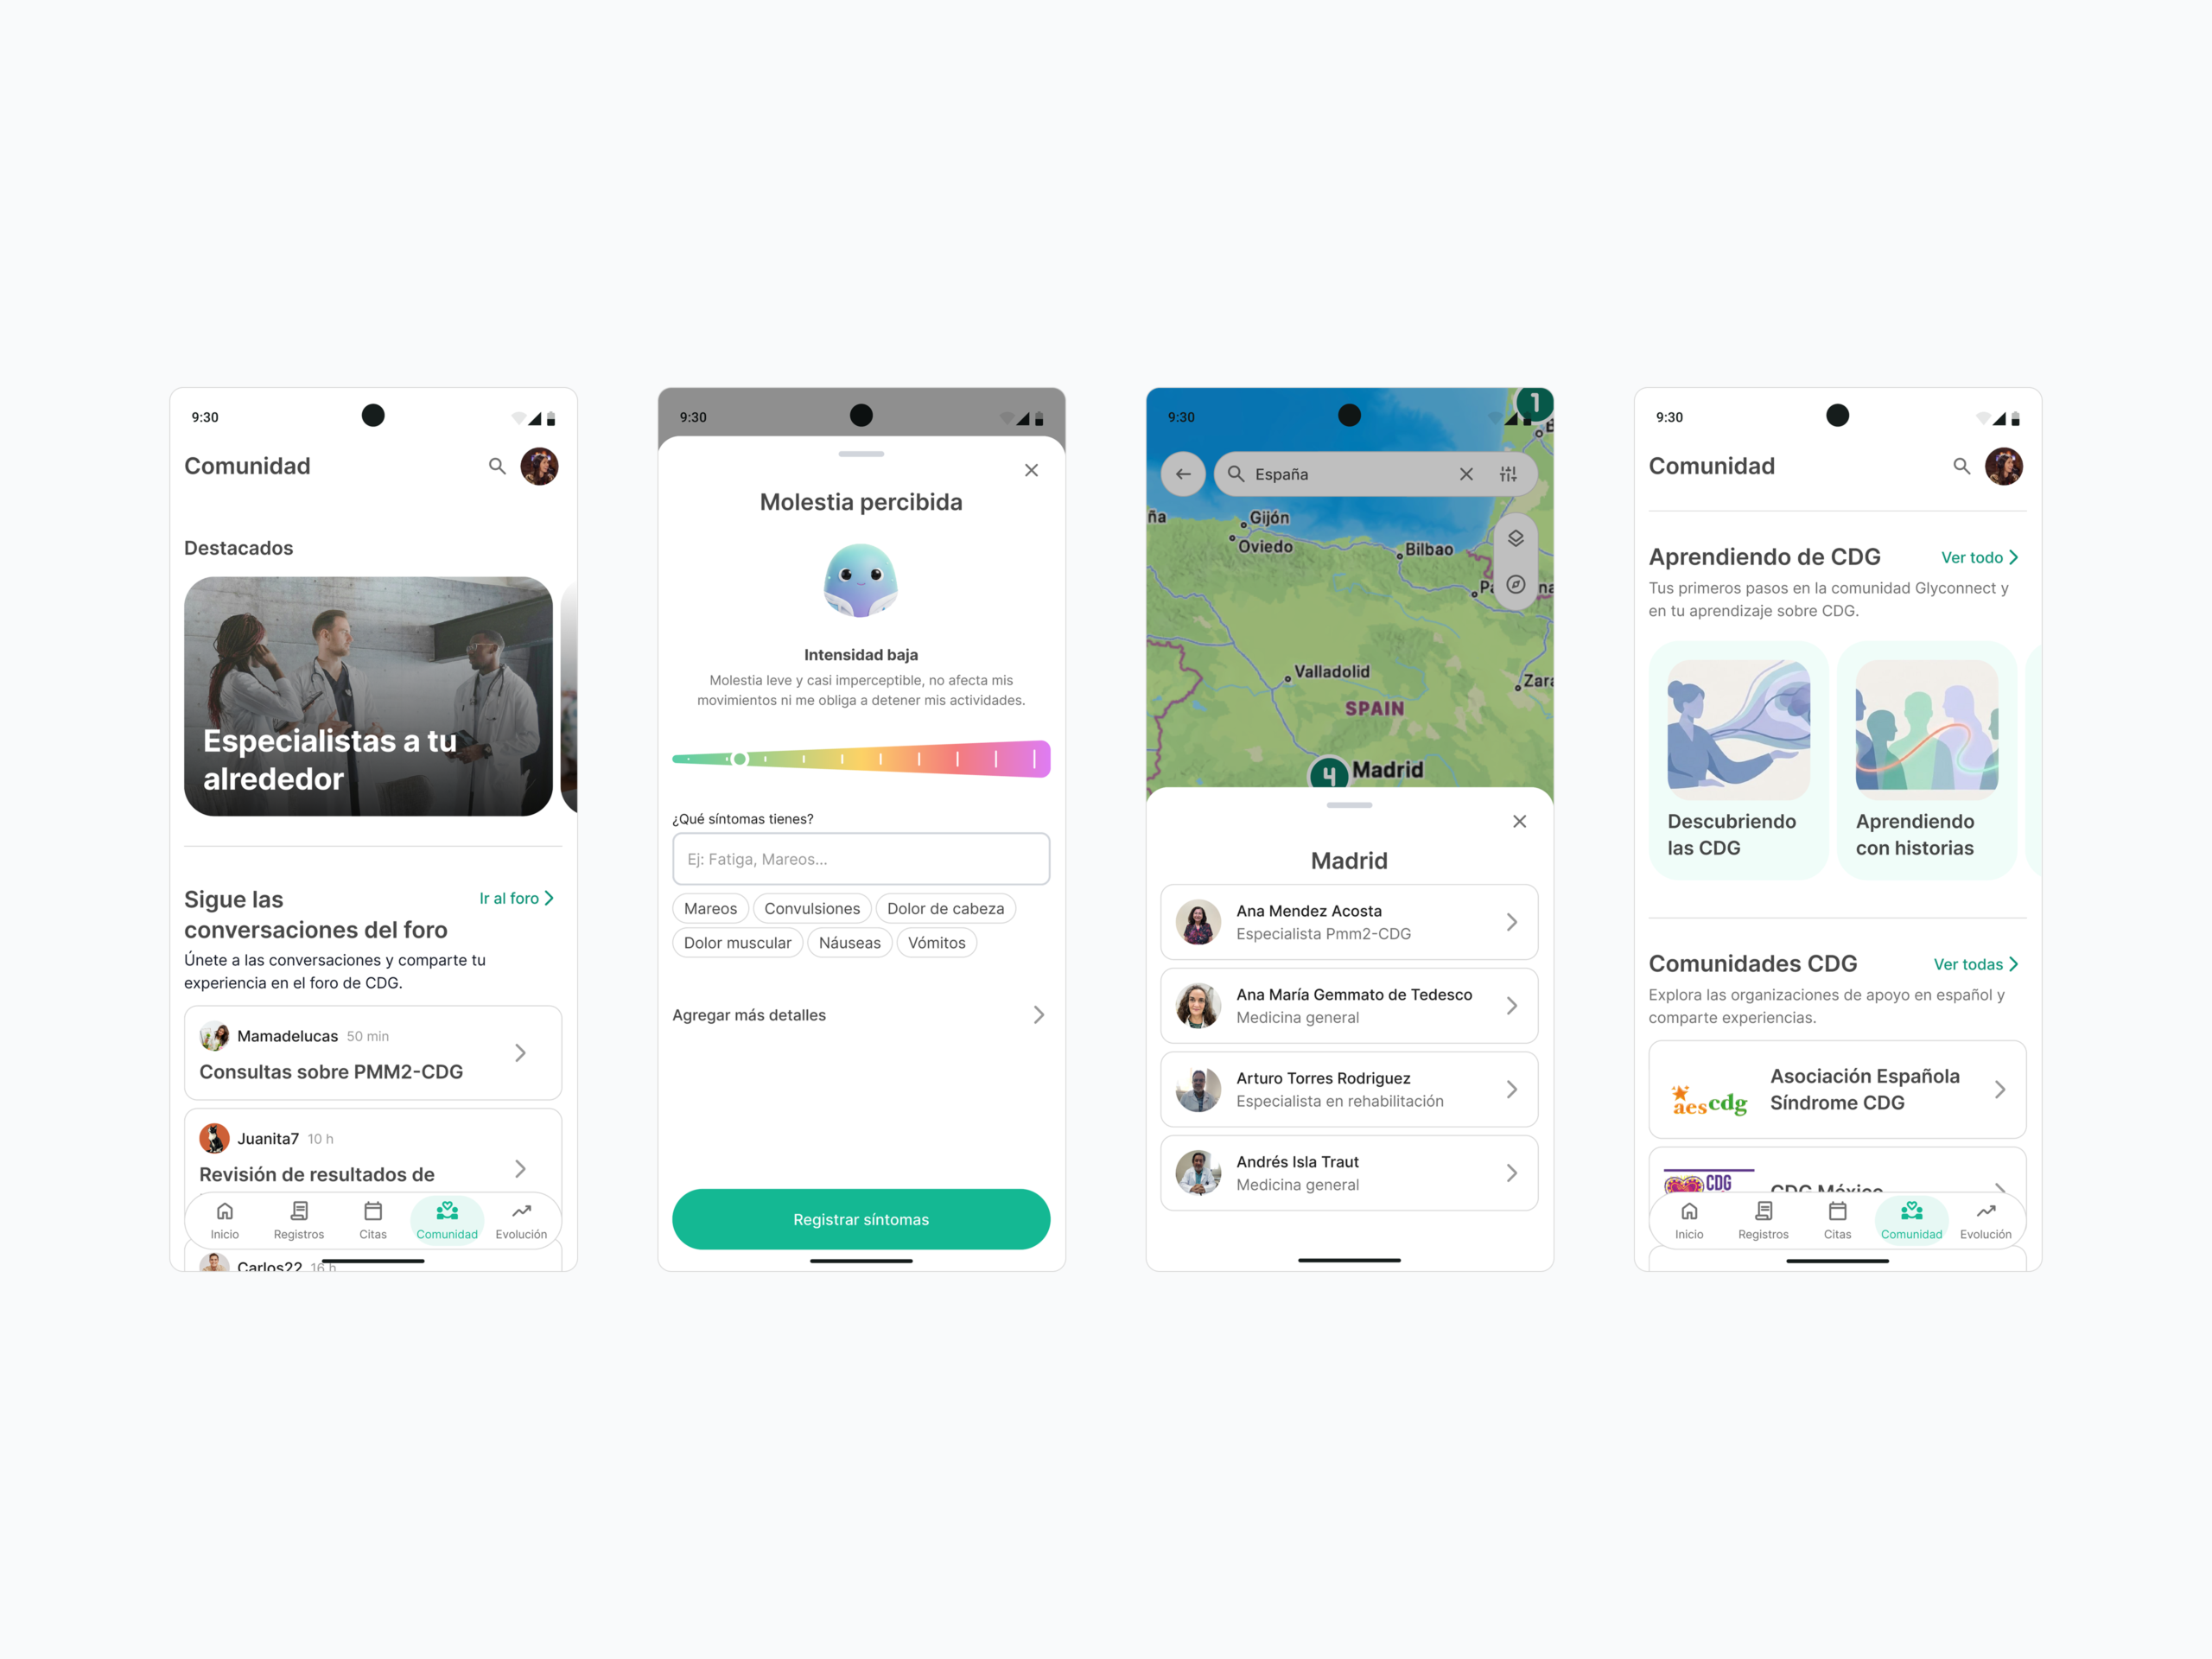
Based on the focus group’s feedback, we iterated the prototype by matching what already existed with the needs and consensus that emerged in the session. We understood we weren’t off track on the recommended features for the product, but we did get the prioritization wrong — the community mattered more than we thought, and we’d overlooked emergencies entirely; in fact, we didn’t even know about the stroke-like episodes. This shows how important it is to get direct feedback from the archetypes tied to the project, and with that in mind, we added:


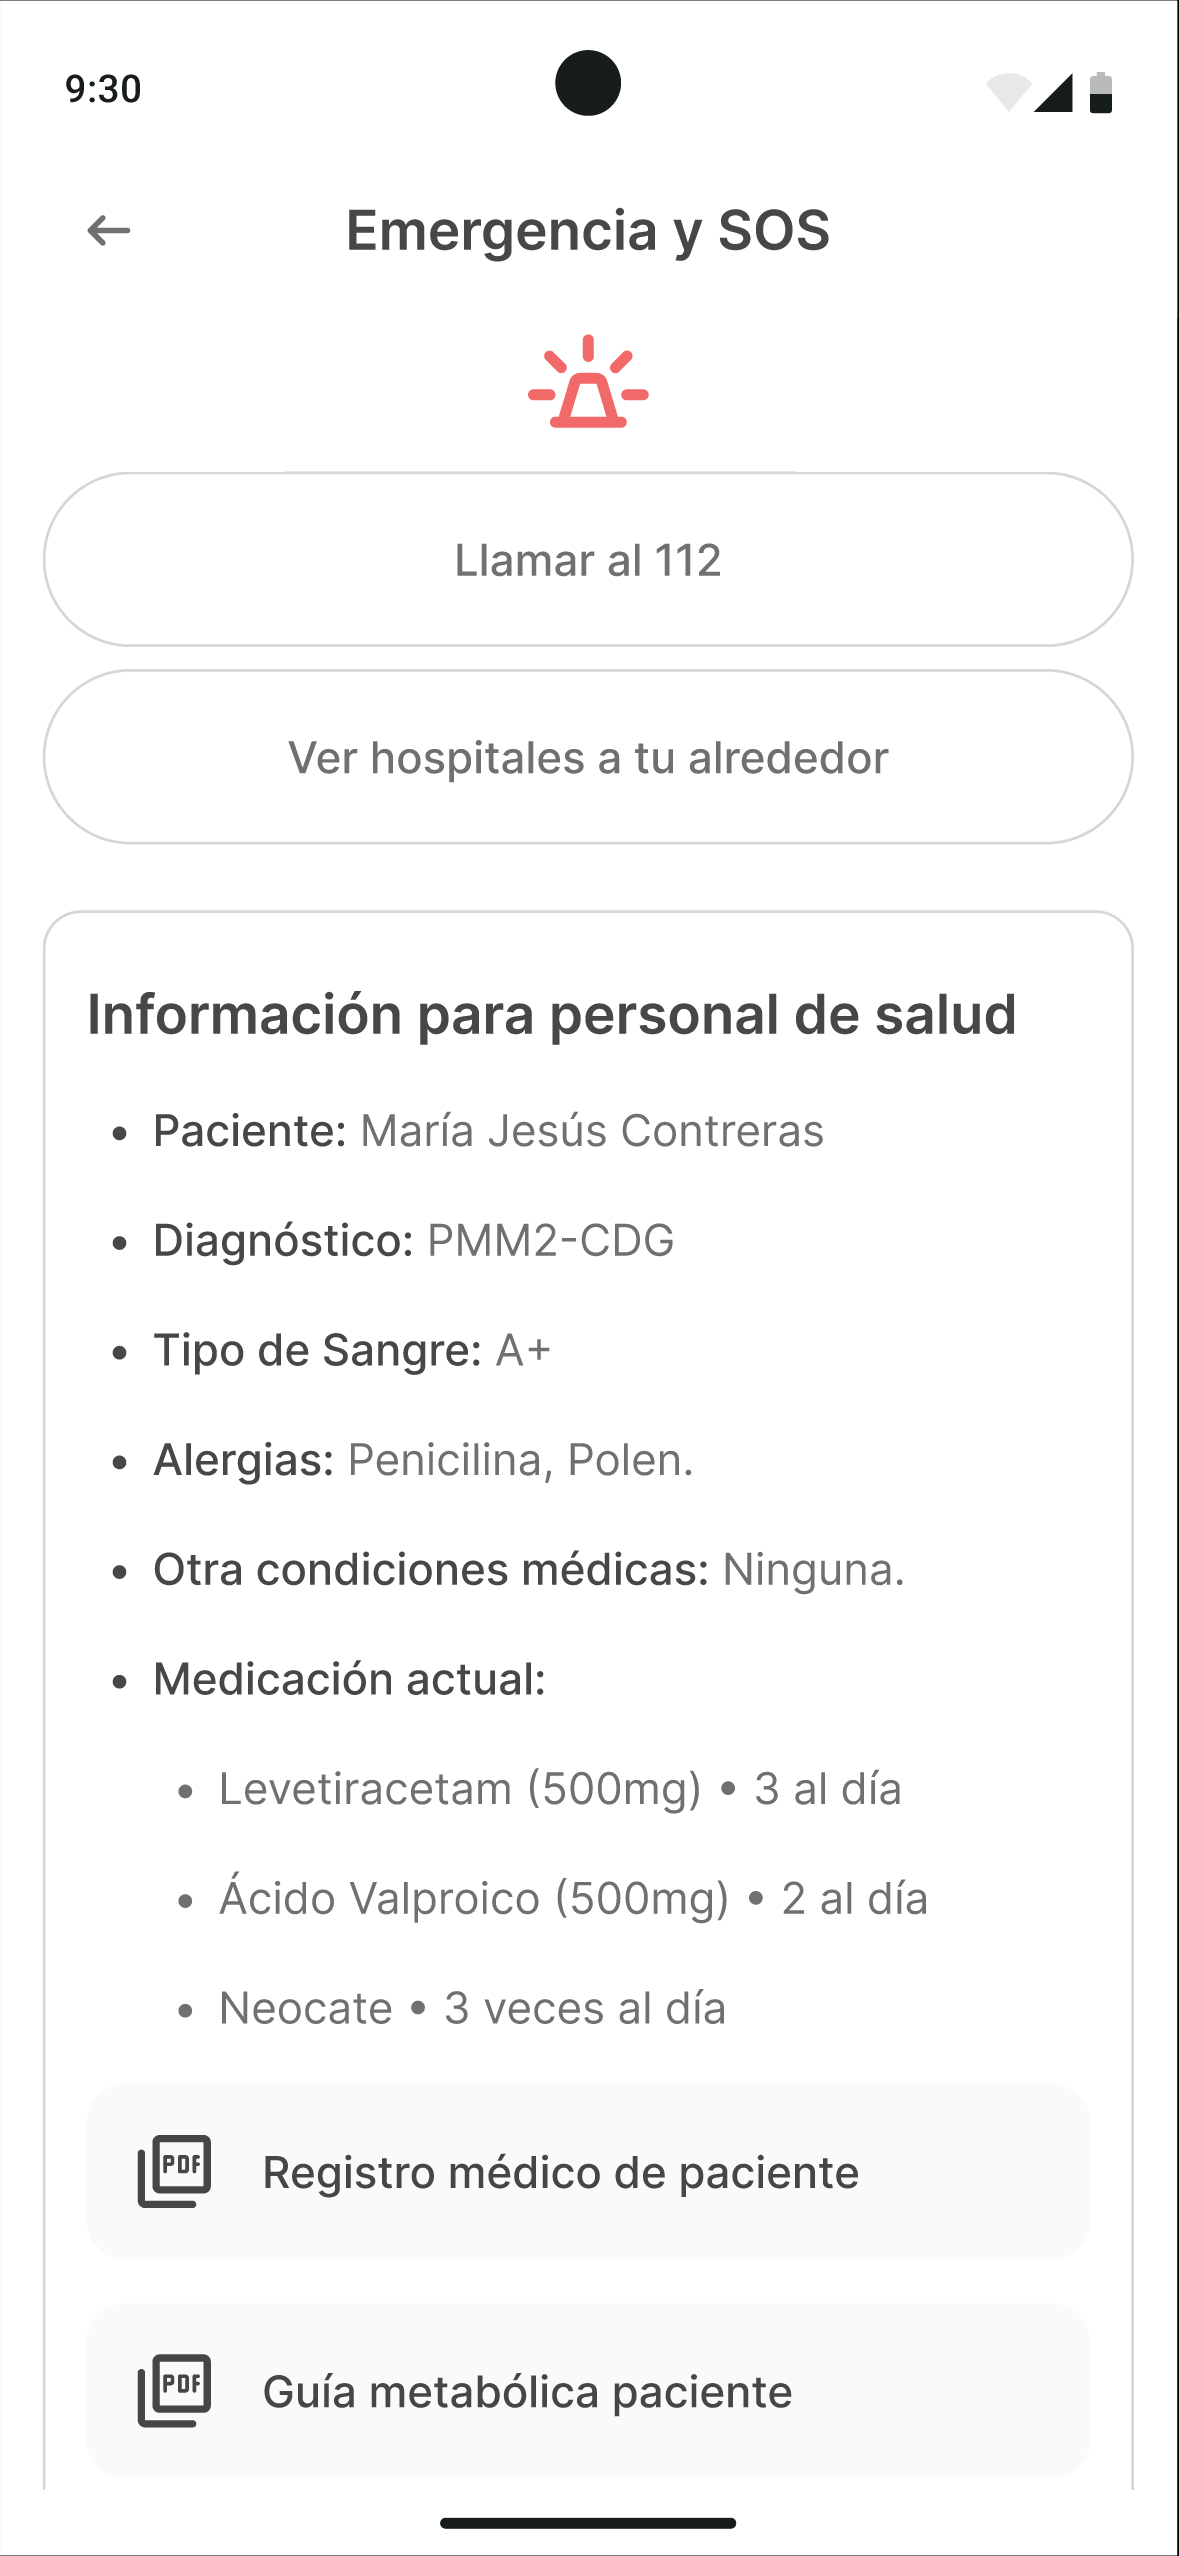
Emergency section

  • Instant access to response protocols specific to each type of CDG
  • Geolocation of centers with adequate care capability
  • Direct emergency call
  • Automatic generation of an executive clinical summary shown to medical staff on arrival at the ER, ensuring vital information — like handling stroke-like episodes — is communicated accurately and quickly.


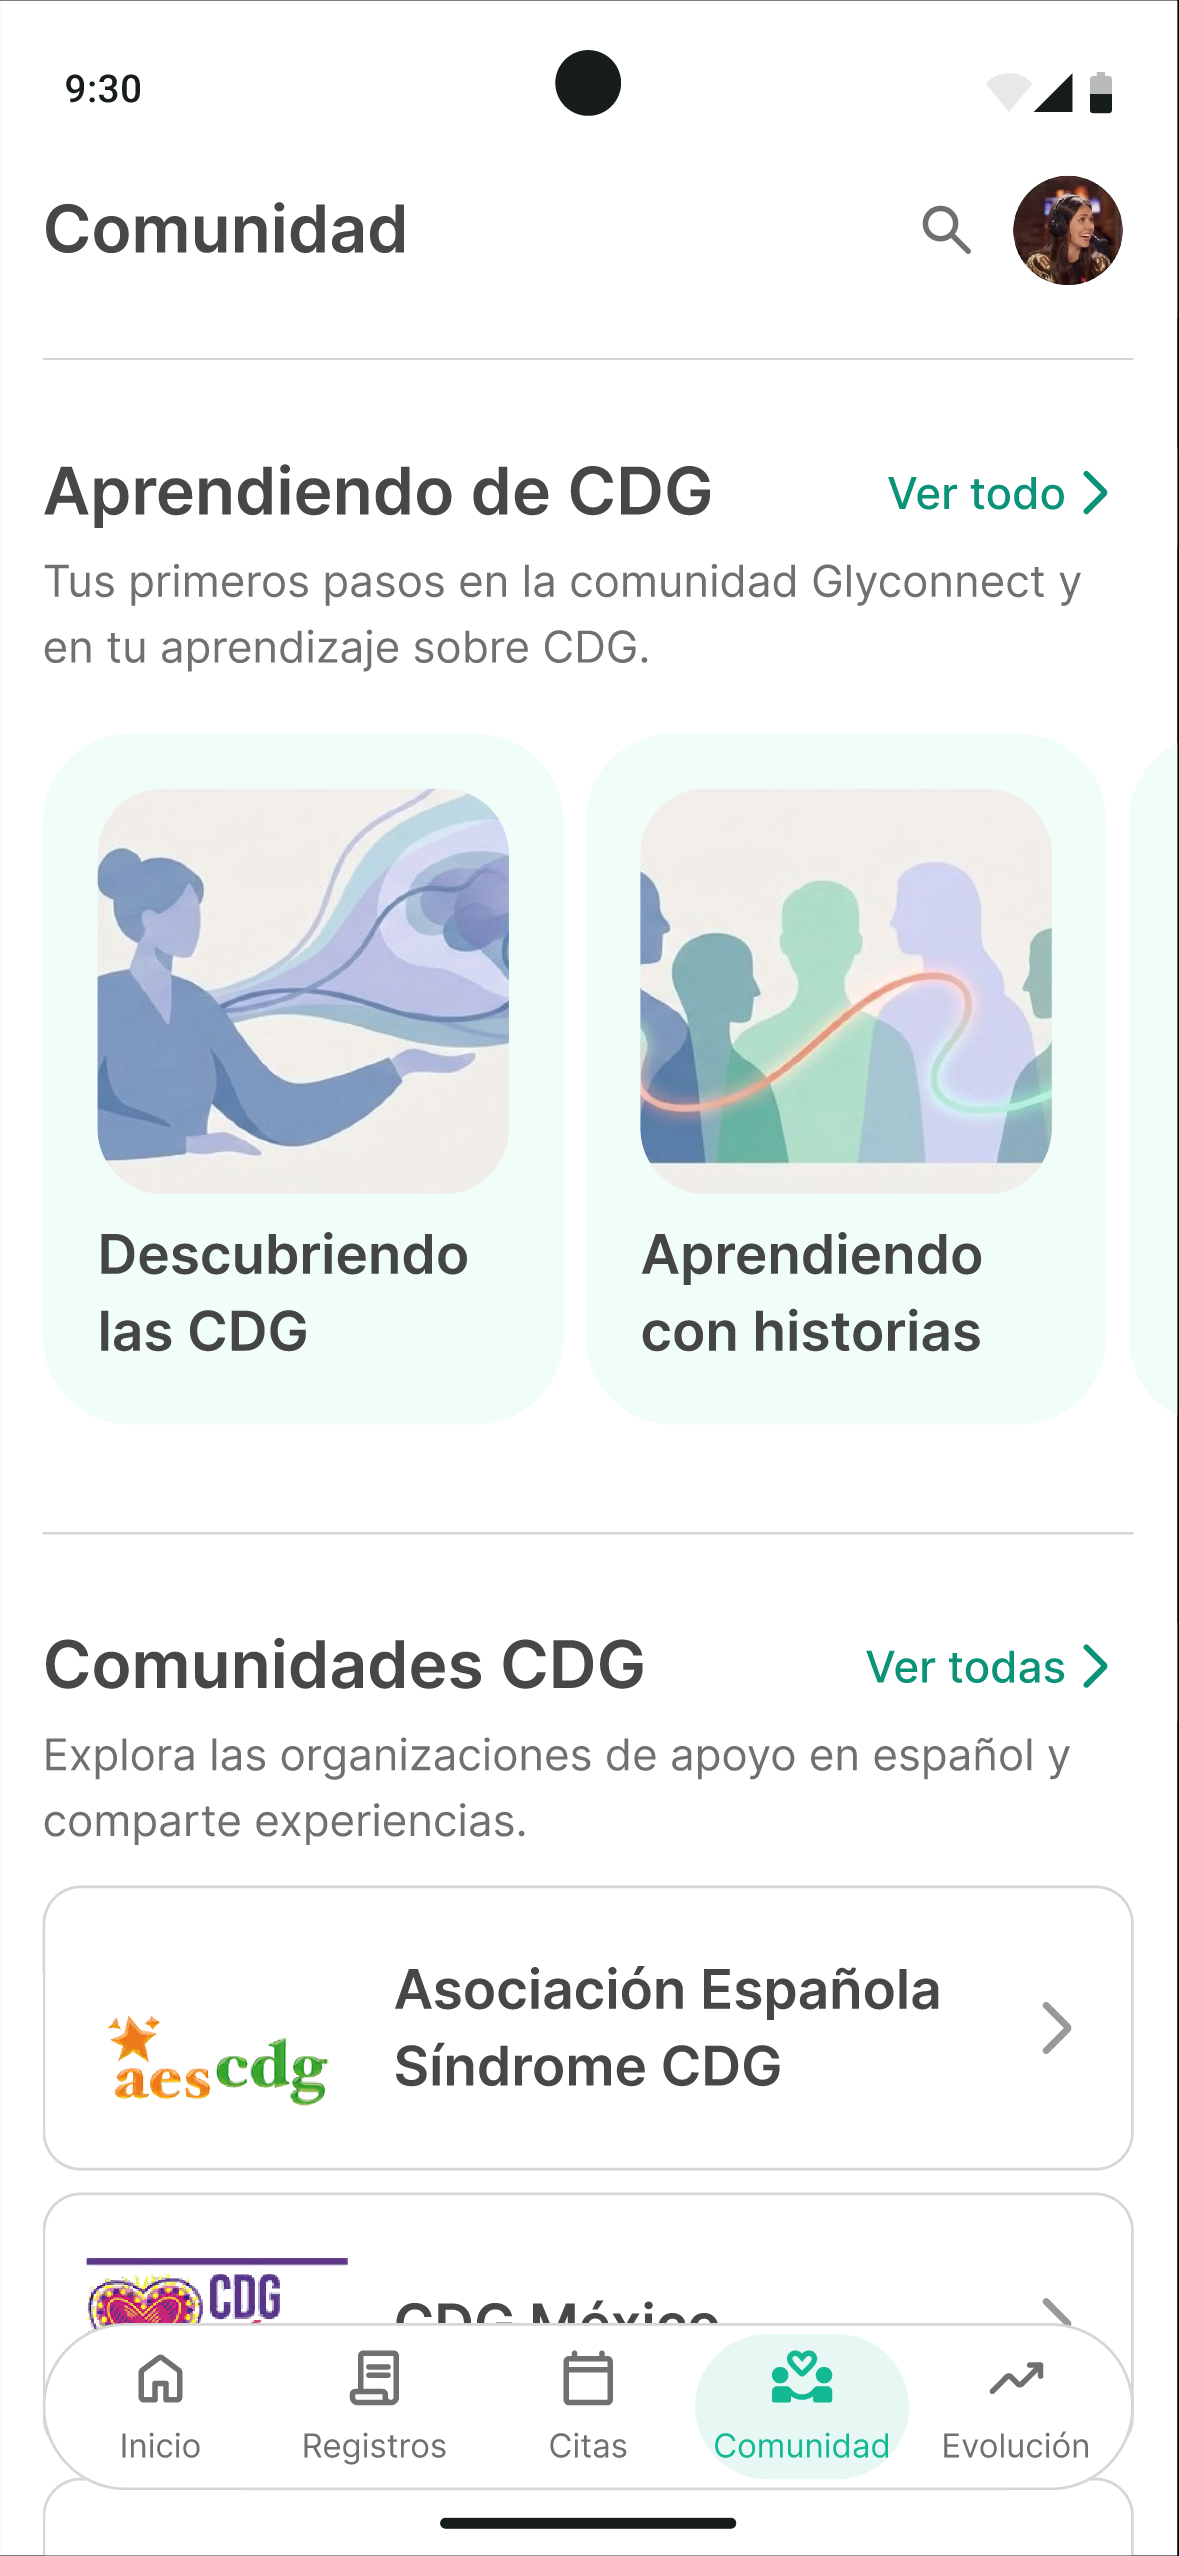
Community section

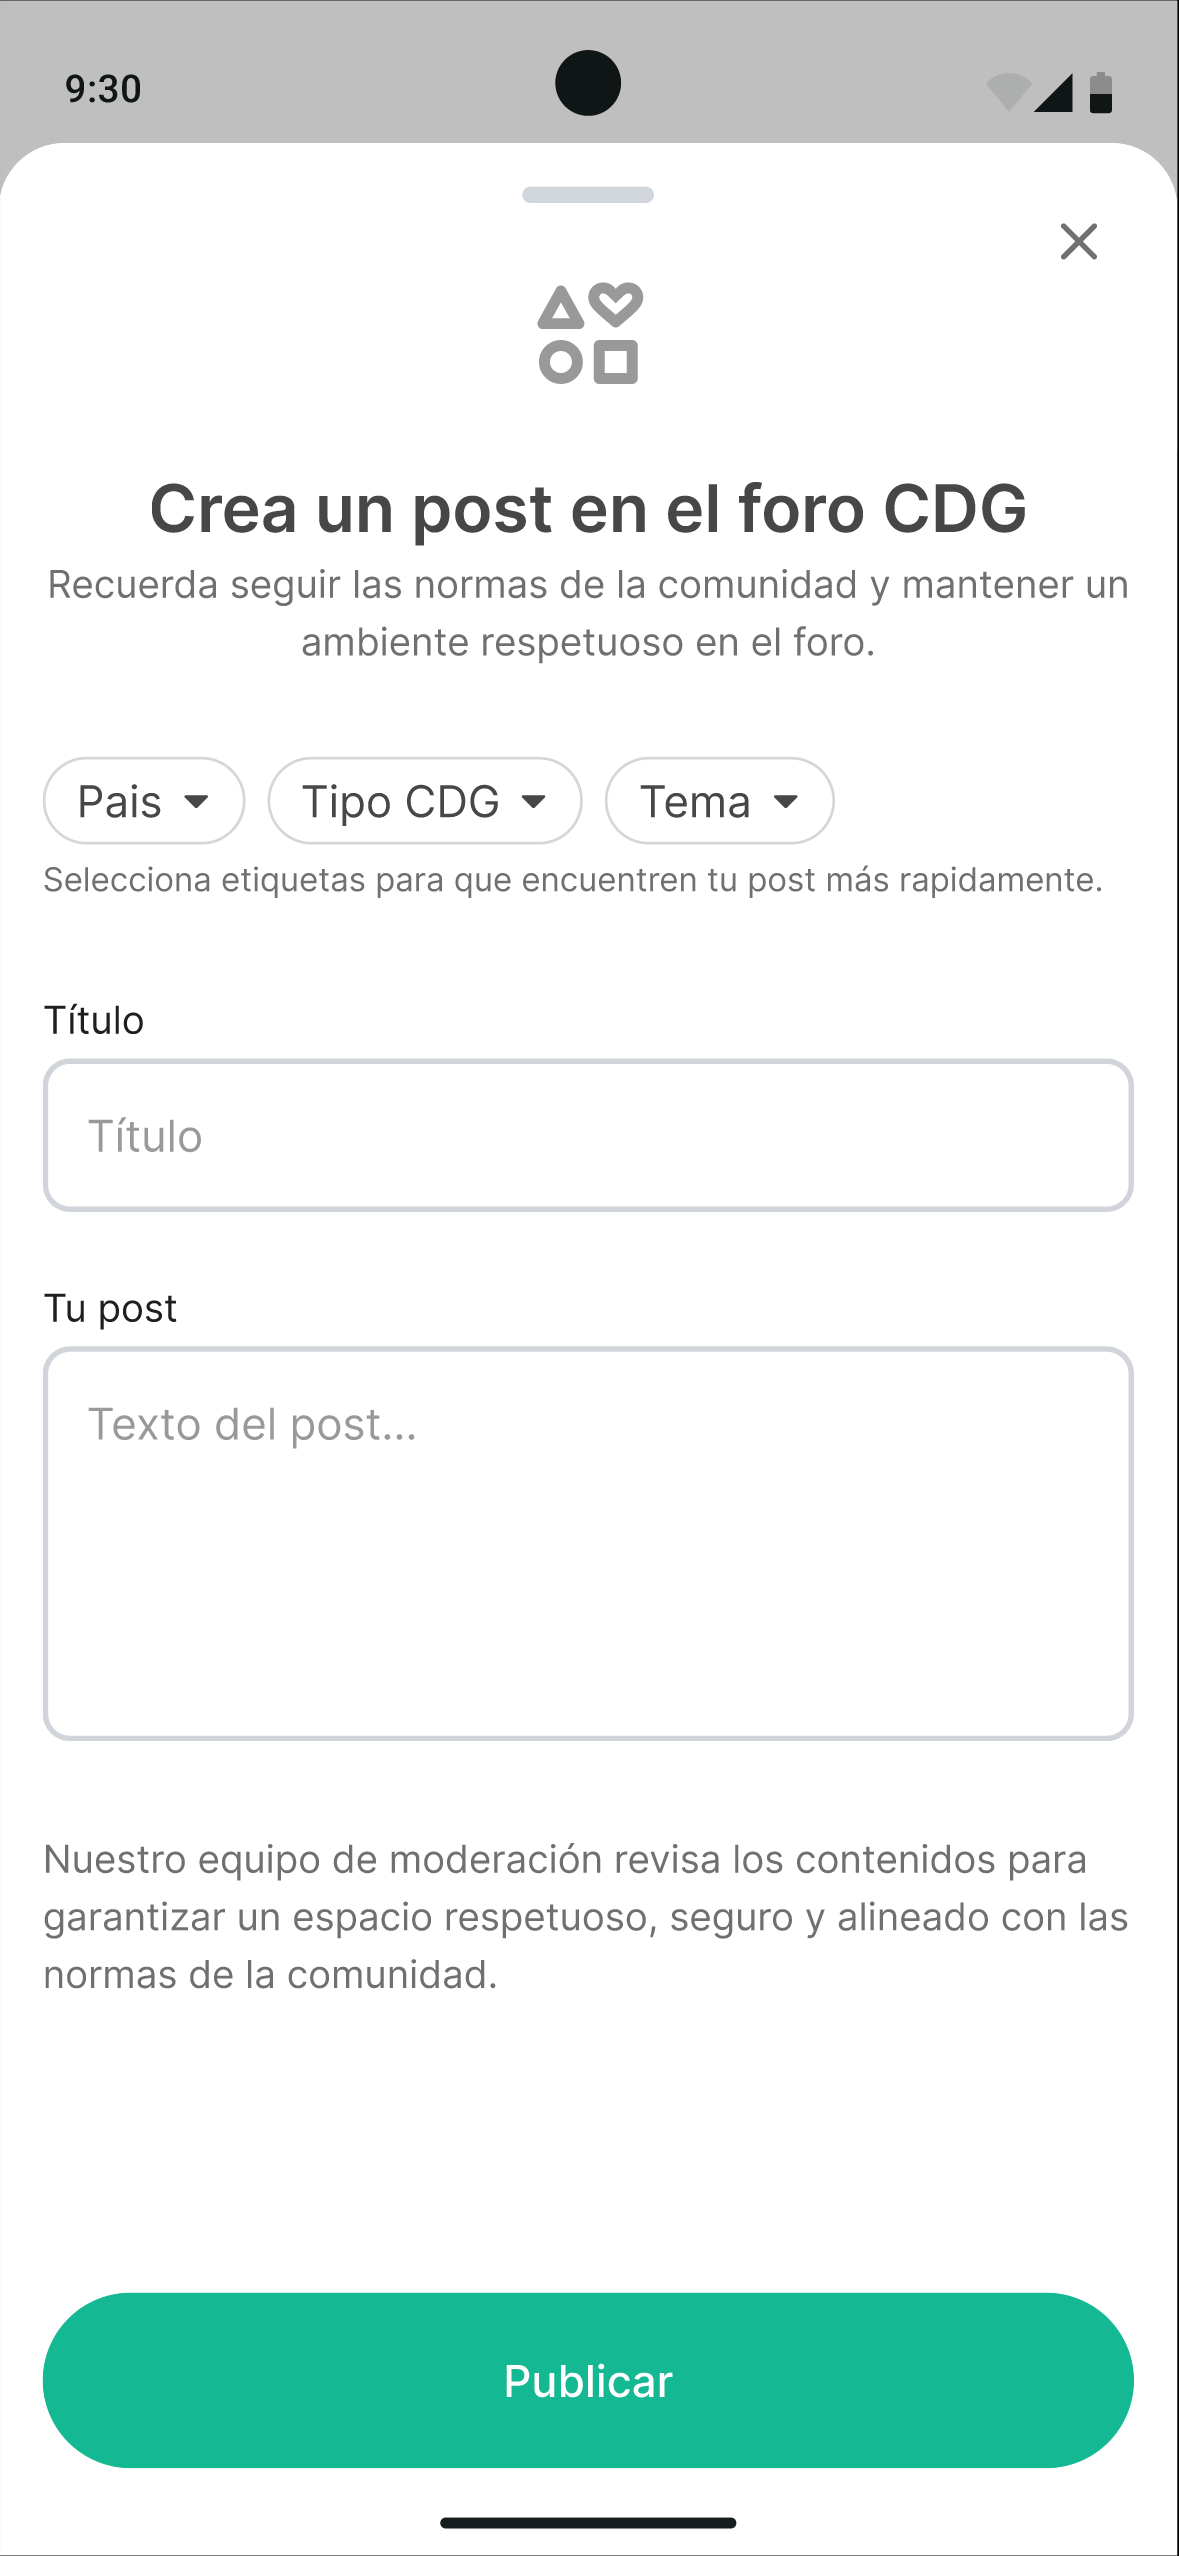
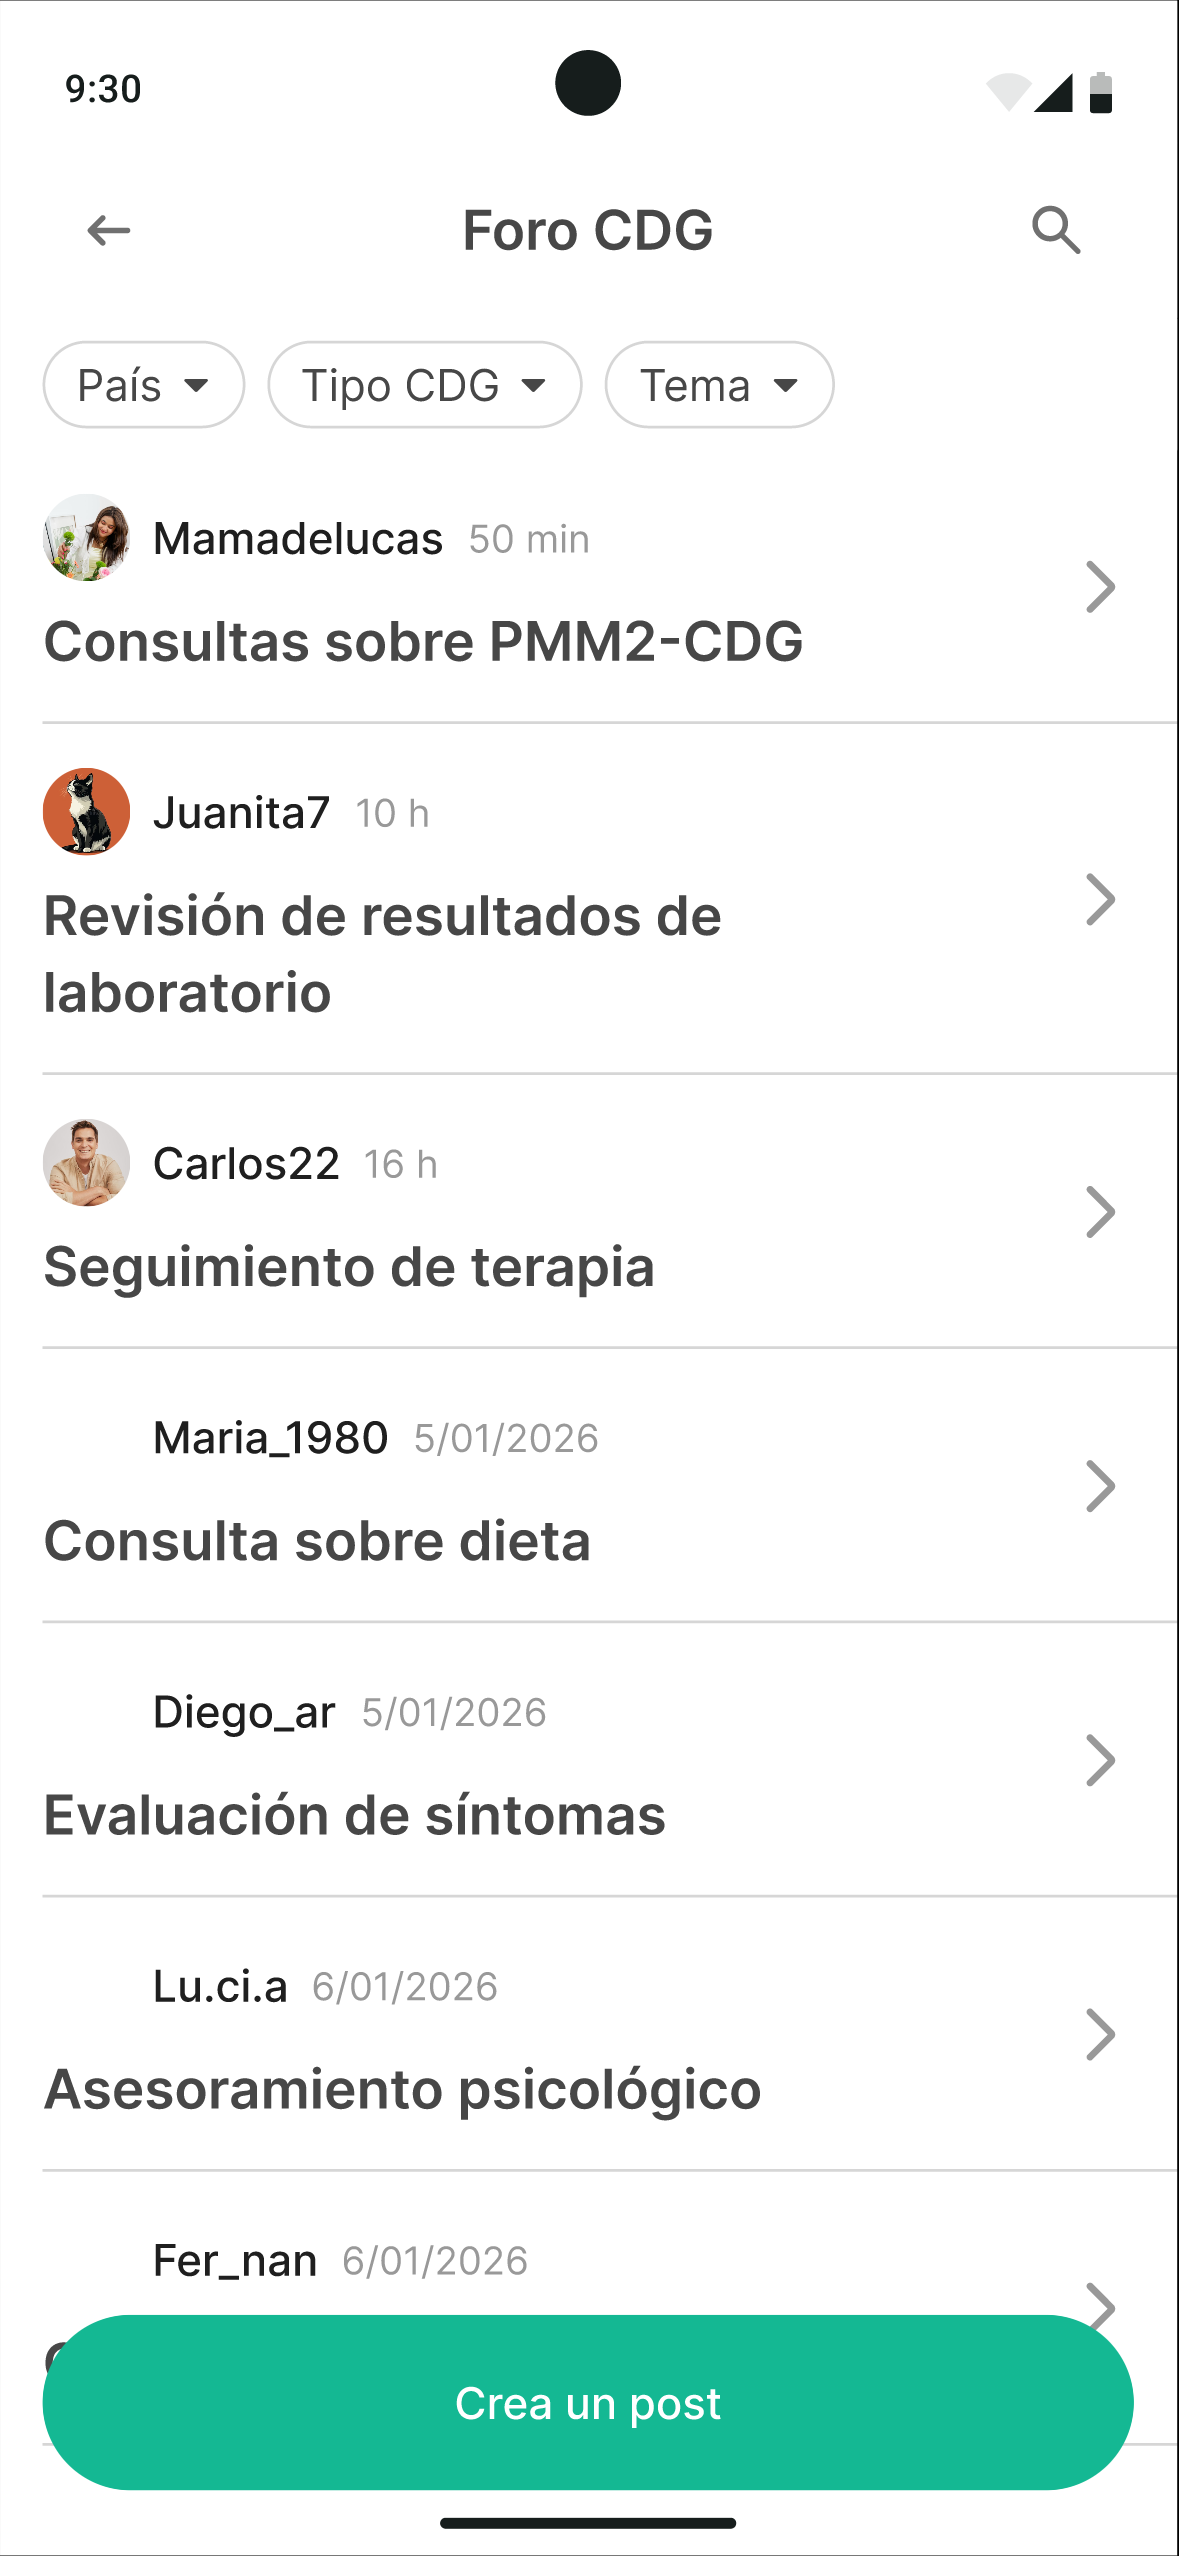
  • A horizontal forum between patients, family members, and professionals
  • Scientific articles and news
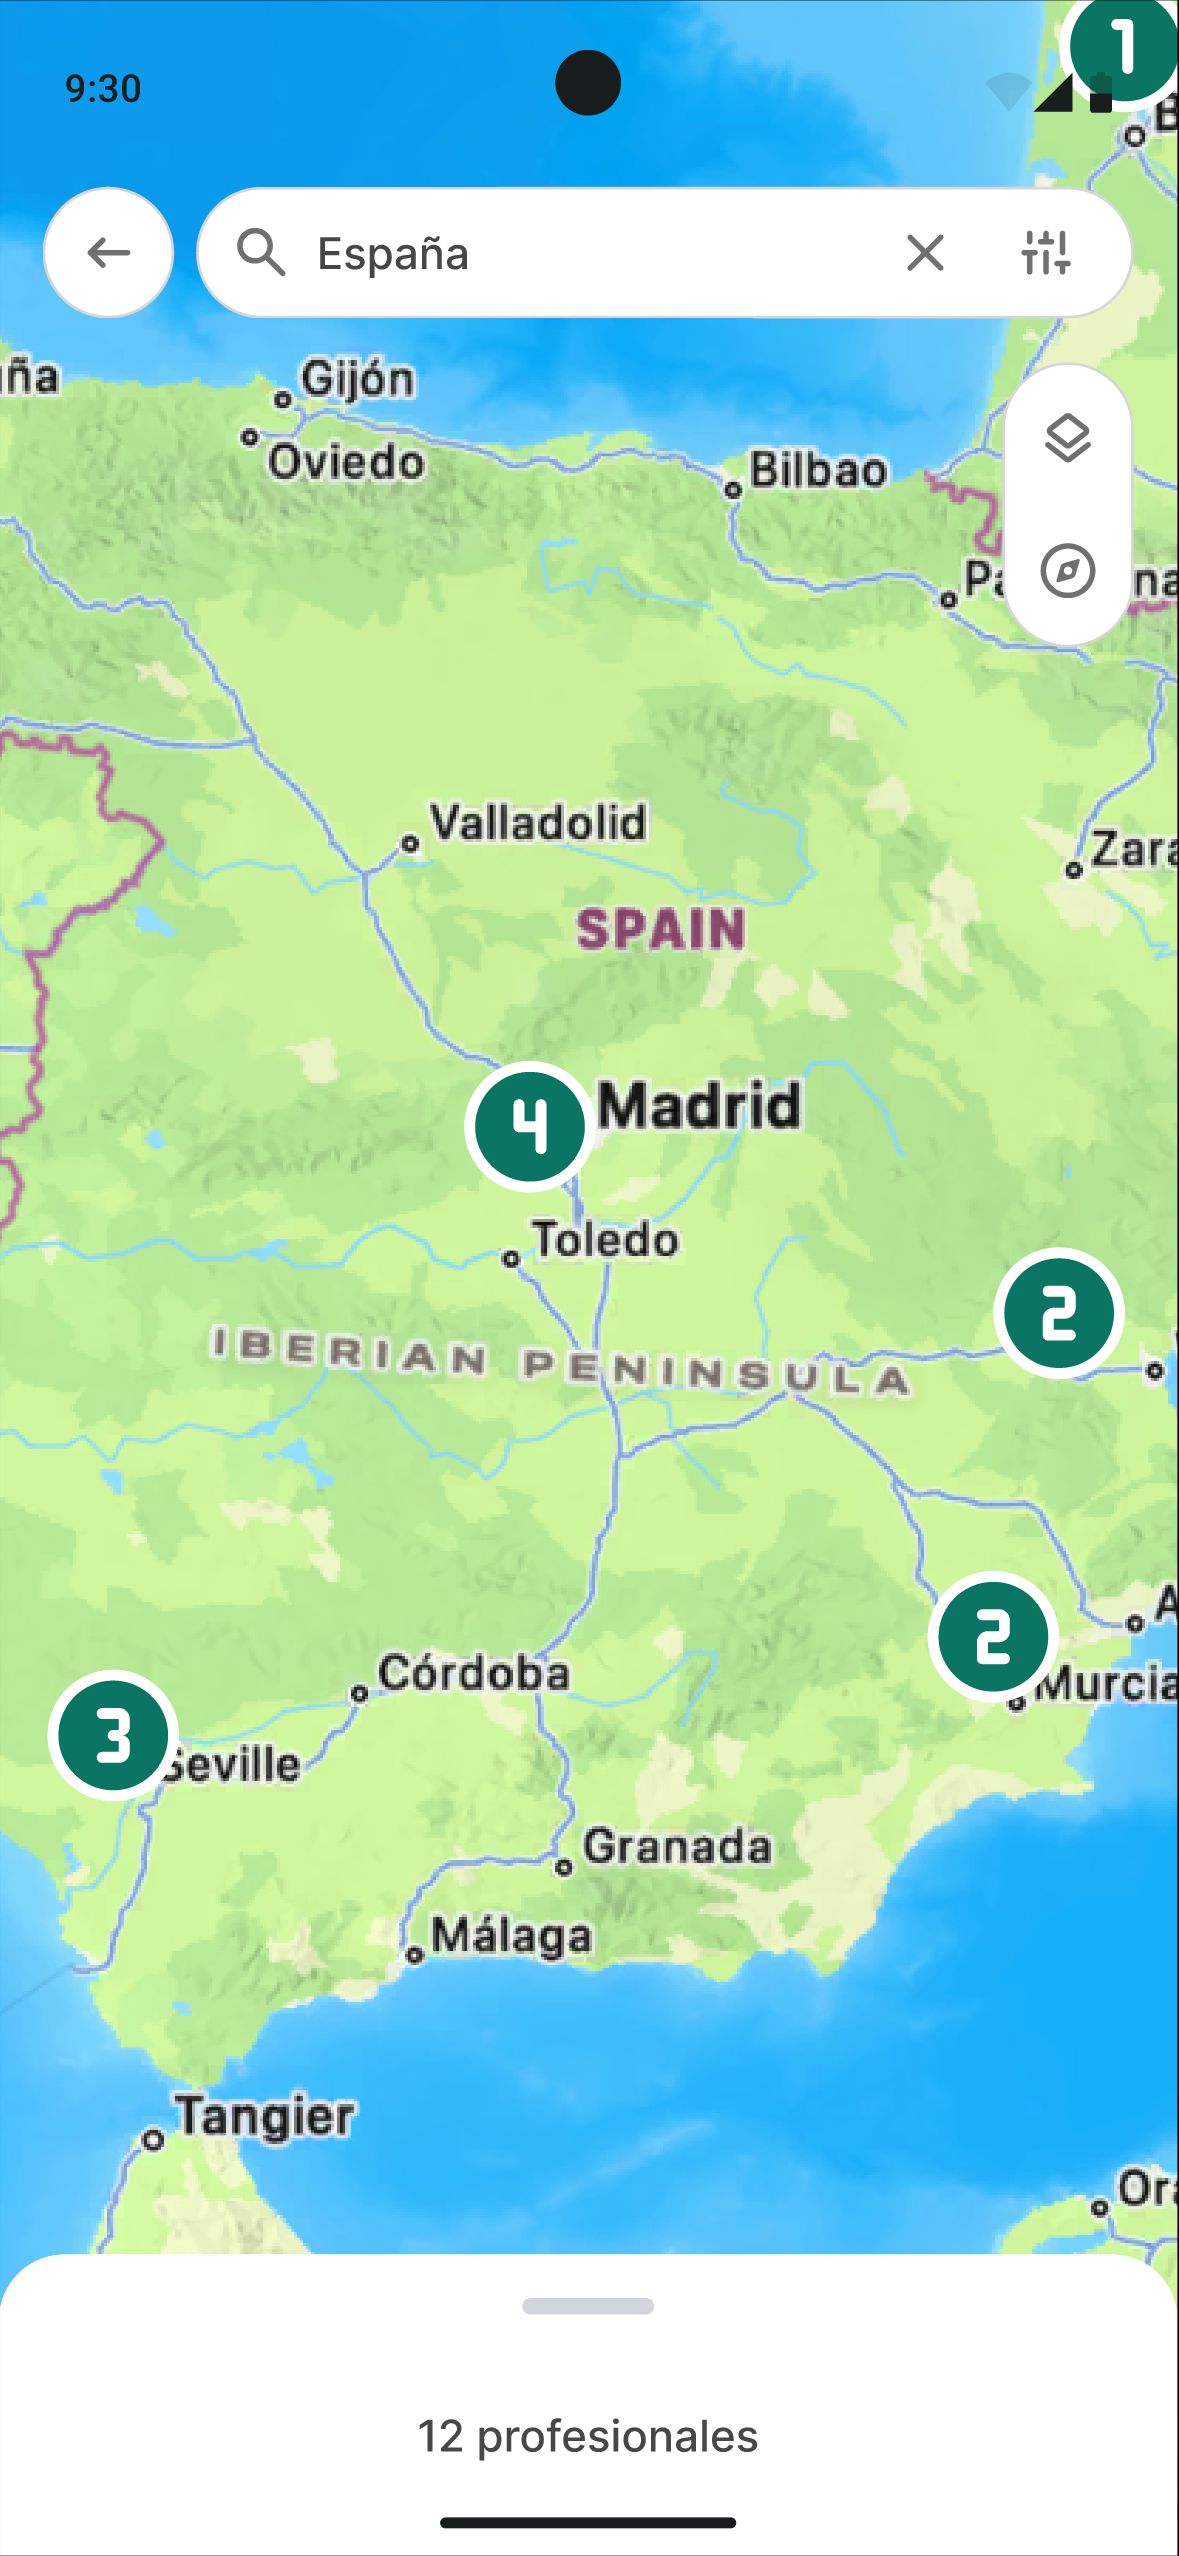
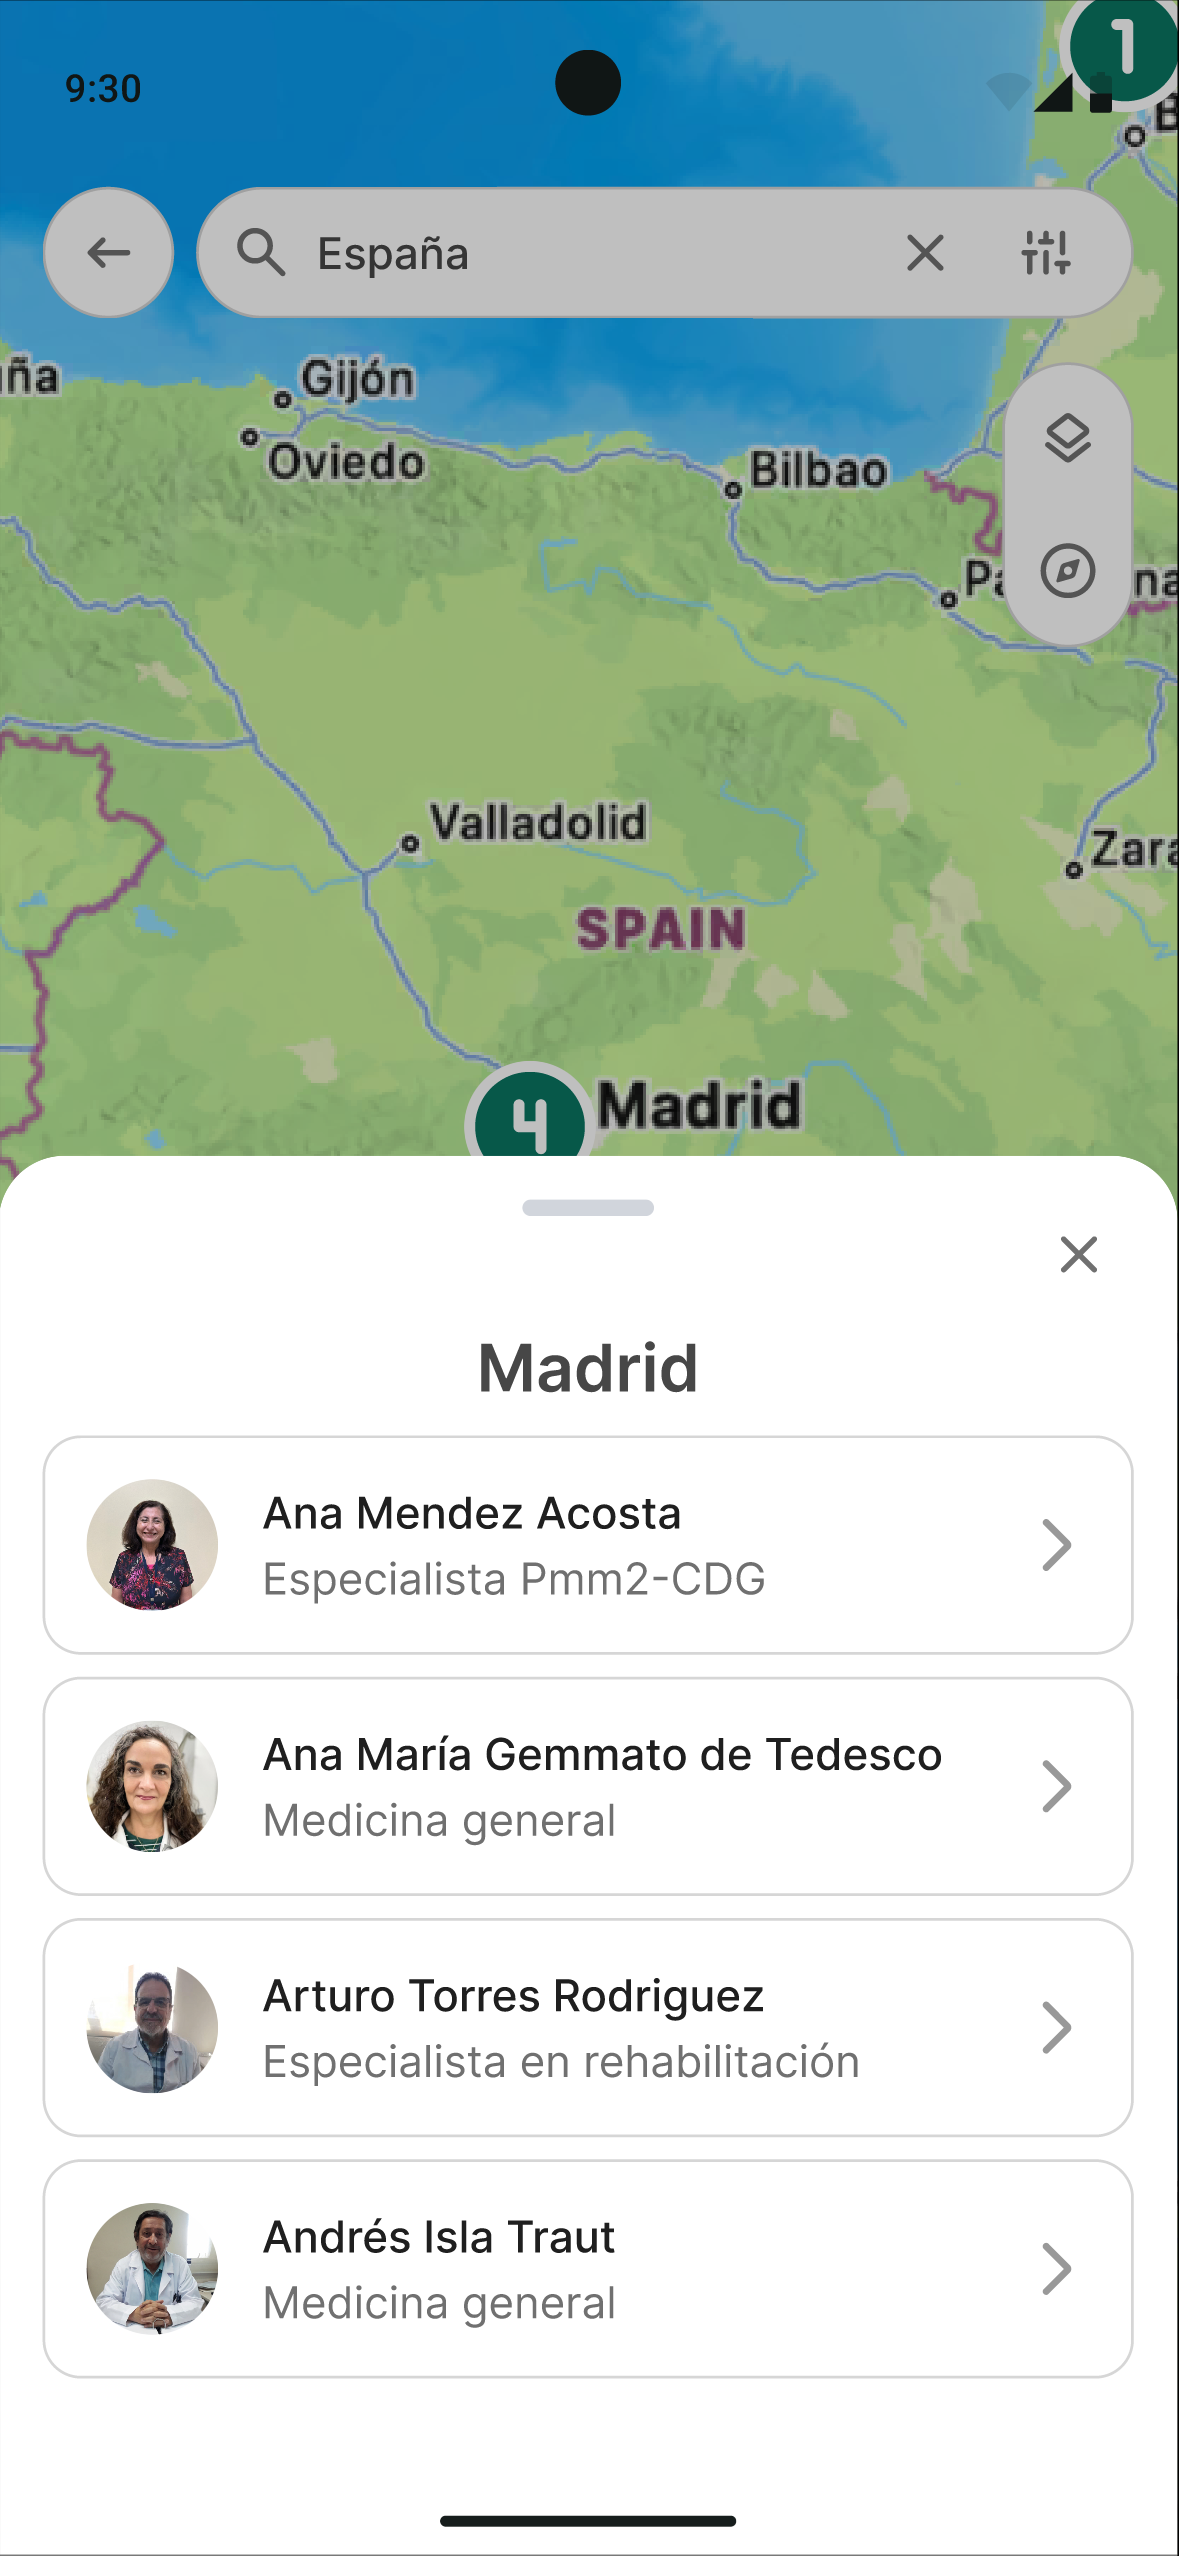
  • A map of specialized professionals
  • Visible integration of existing CDG associations. Designed to build health literacy and a global support network.

Results and conclusions

The project culminated in GlyConnect, a high-fidelity interactive prototype that grew from a health diary into a comprehensive companion space, useful for the patient’s present as well as valuable for the future of research.

The contributions, from a UX design perspective:

  • UCD in sensitive health contexts with restricted user access
    This case shows how to apply user-centered design when contact with the end user is limited (in this case by the CDG diseases), and how important the transition from a design based mostly on secondary research to one validated by the community is — and also an ethical commitment to listening.
  • The prototype as a mediation artifact
    More than an interface, it was a communicative bridge that let researchers and the community compare worldviews, connecting patient-generated data (PGHD, or patient generated health data) with research.
  • Compassionate design for vulnerability
    Prioritizing emergencies and community recognizes that the user is often in a state of emotional vulnerability, and with that in mind, the design also takes on a role of care and companionship.

Learnings and next steps

I’m taking a few important things with me for the next big projects on my path to becoming a better product designer. First, no secondary research, however thorough, can ever replace a direct testimony — talking to people and truly understanding the why behind their problems, their day-to-day, and hearing a firsthand account of what they actually live through.

When it came to CDG, parents sometimes knew more than non-specialized doctors about which orphan drugs to use, what to do and how, and they were also experts at connecting, building community, and making their struggle visible. I’m grateful to them for trusting my team enough to let us carry this project forward — one so important to many and so little seen.

There’s nothing wrong with adjusting course halfway through what you’re doing; it shows you’ve gained more understanding, and the more understanding you have, the better your solution becomes, keeping in mind that every project has to be aware of the context it happens in, both emotionally and geographically.


Now, what would I recommend as next steps for the project:

  • Expand and validate the informational repository
  • Bring in profiles not yet integrated (lab researchers, primary care, health management, the wider family unit)
  • Internationalization and cultural adaptation beyond the Spanish-speaking world.
  • Evolve toward an open-data platform (with ethical safeguards) and AI modules for pattern detection, bringing the patient’s reality closer to the lab.

GlyConnect was developed as a Master’s Thesis in User Experience Design (UNIR), in response to a business challenge from Humanized Solutions. Project carried out together with Remedios Broceño and Madeline Quirós, under the supervision of María José Revuelta.

Thank you for taking the time to read this case study.

keyboard_arrow_up